 4
4peptides
spectra
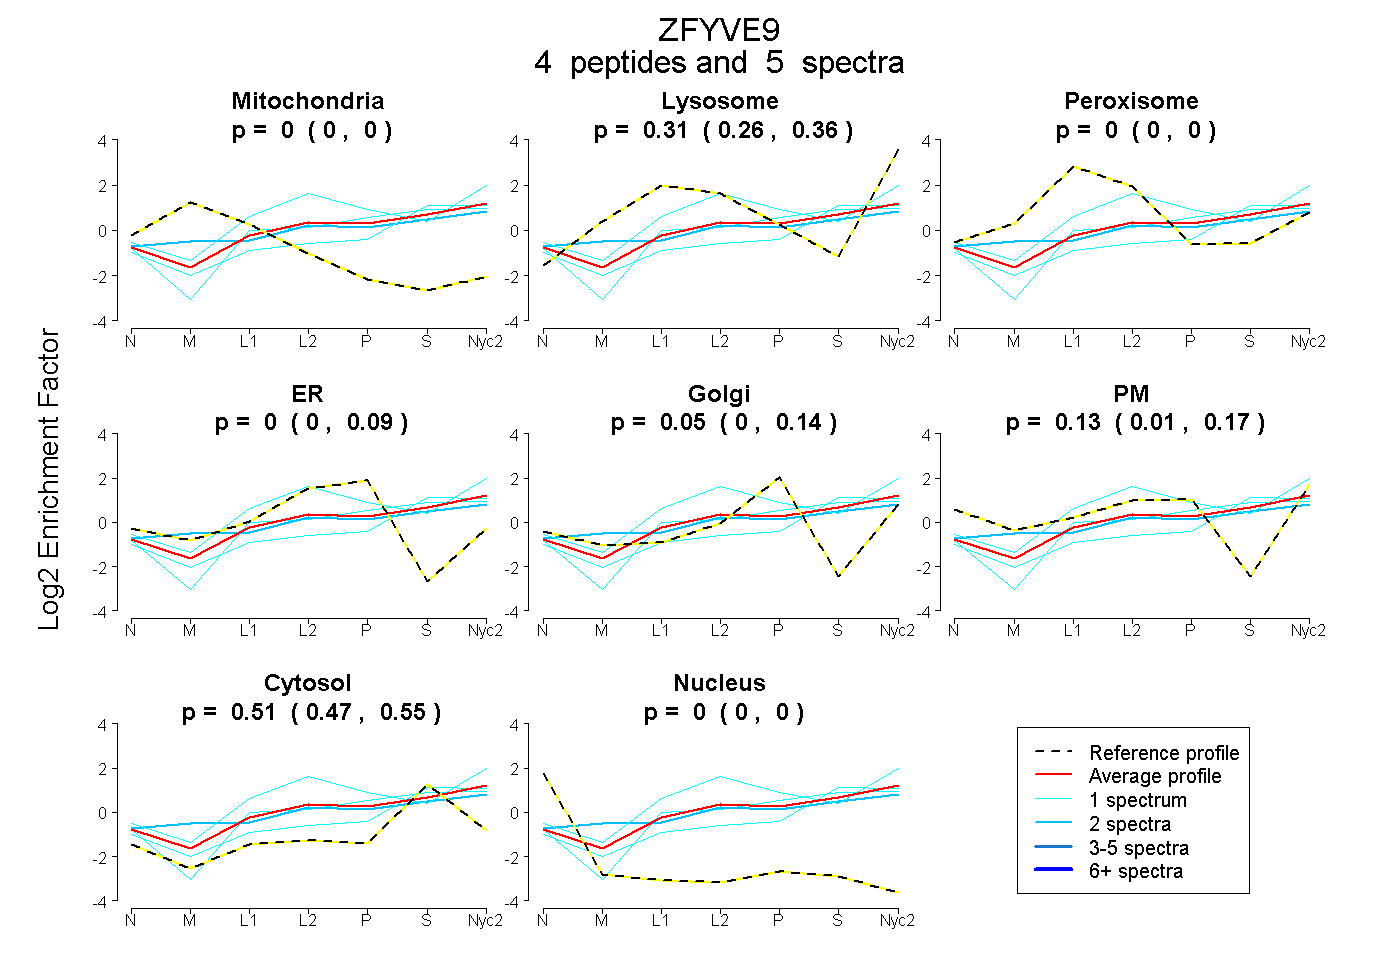
0.000 | 0.000
0.263 | 0.358
0.000 | 0.001
0.000 | 0.087
0.000 | 0.143
0.008 | 0.172
0.466 | 0.549
0.000 | 0.000
1peptide
spectrum
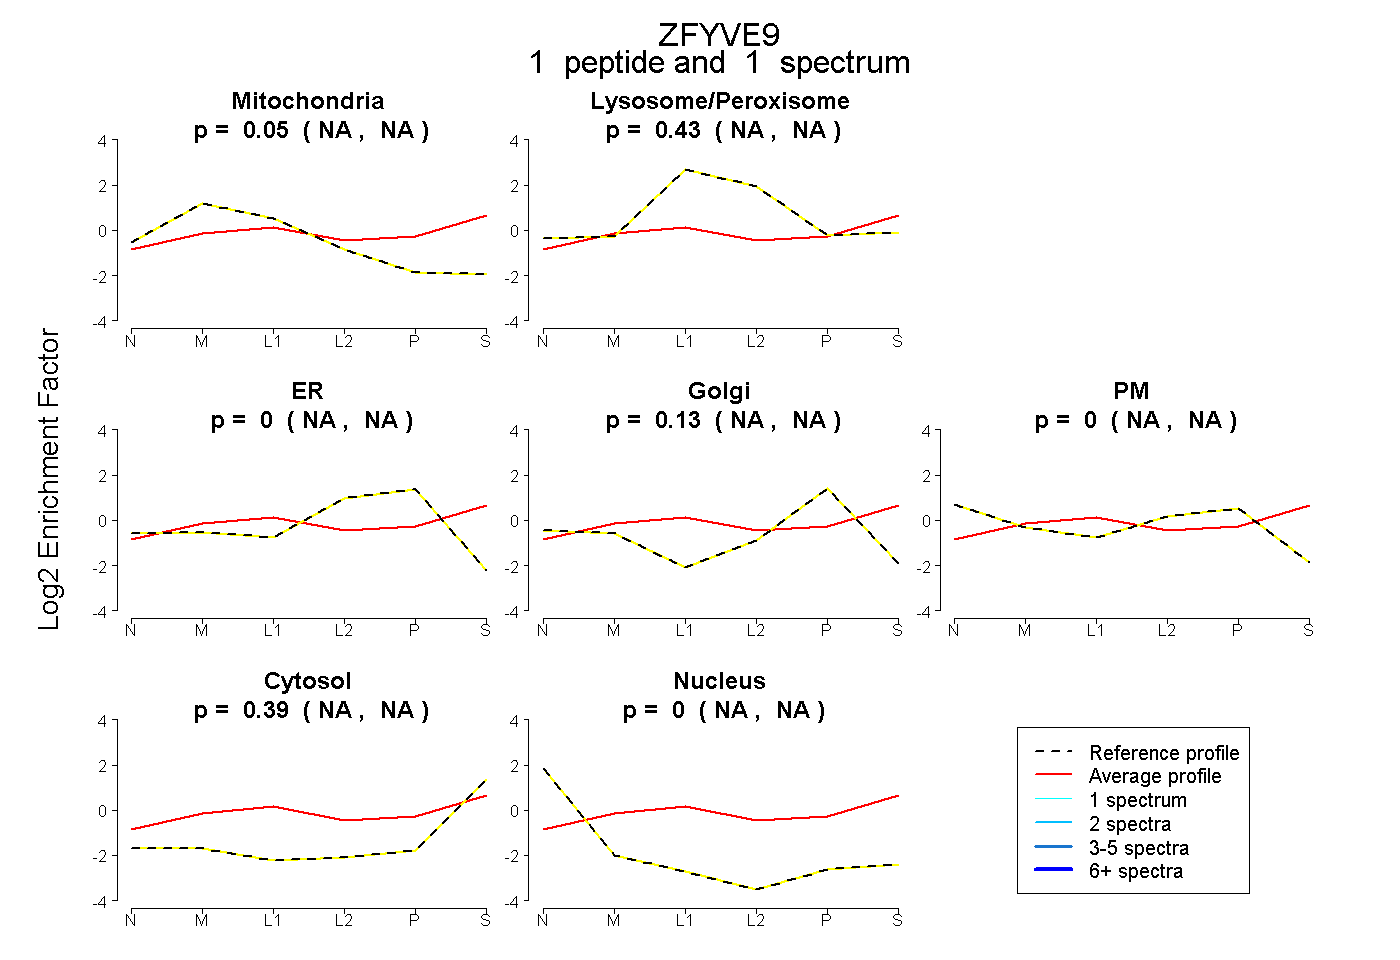
NA | NA
NA | NA
NA | NA
NA | NA
NA | NA
NA | NA
NA | NA
4peptides
spectra
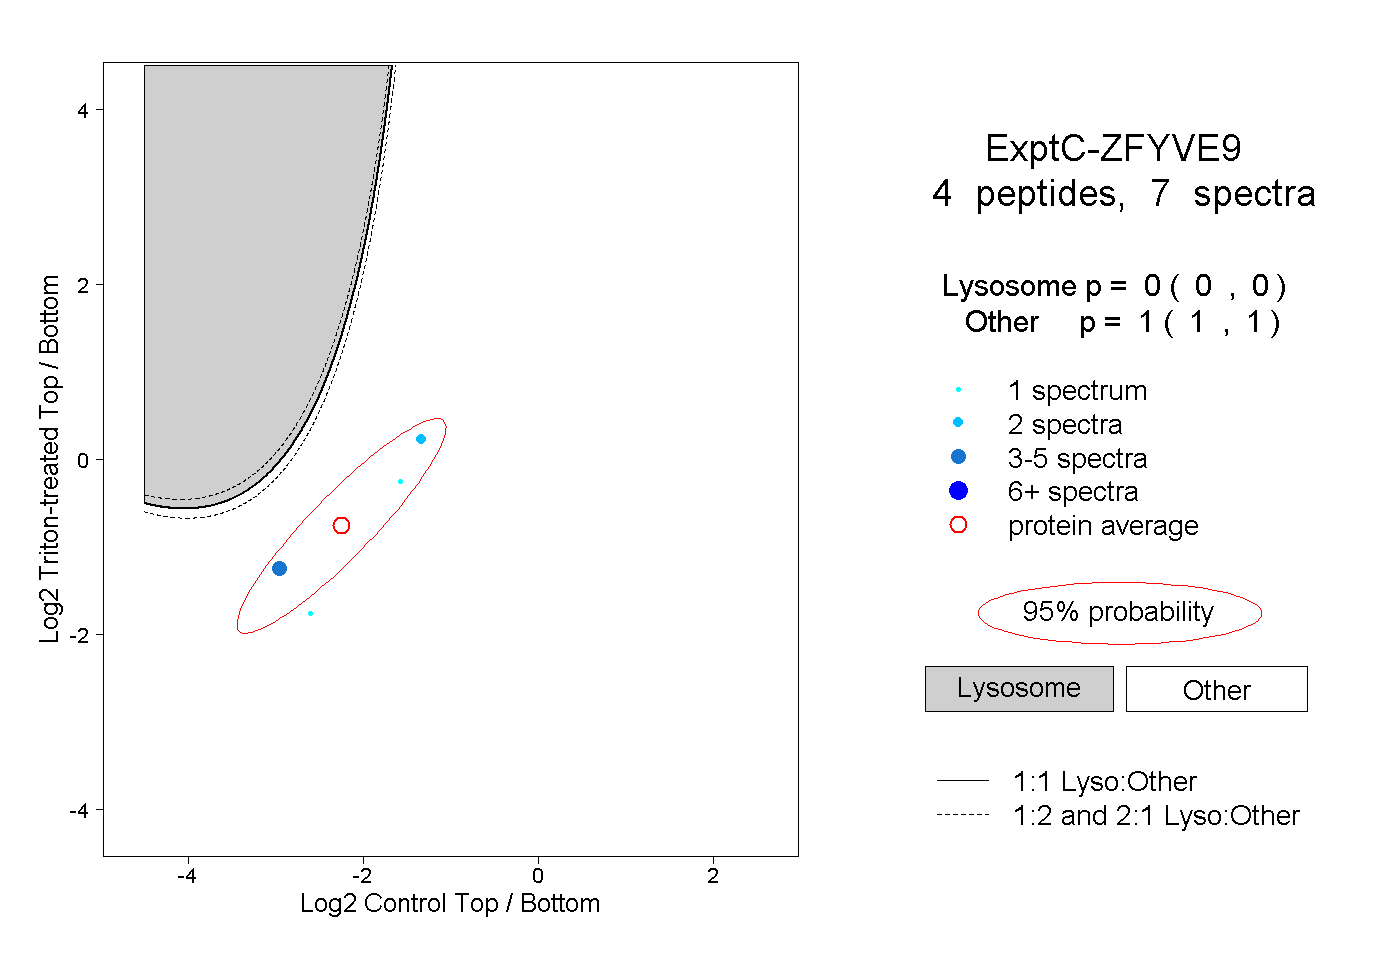
0.000 | 0.000
1.000 | 1.000