 4
4peptides
spectra
0.000 | 0.000
0.263 | 0.358
0.000 | 0.001
0.000 | 0.087
0.000 | 0.143
0.008 | 0.172
0.466 | 0.549
0.000 | 0.000
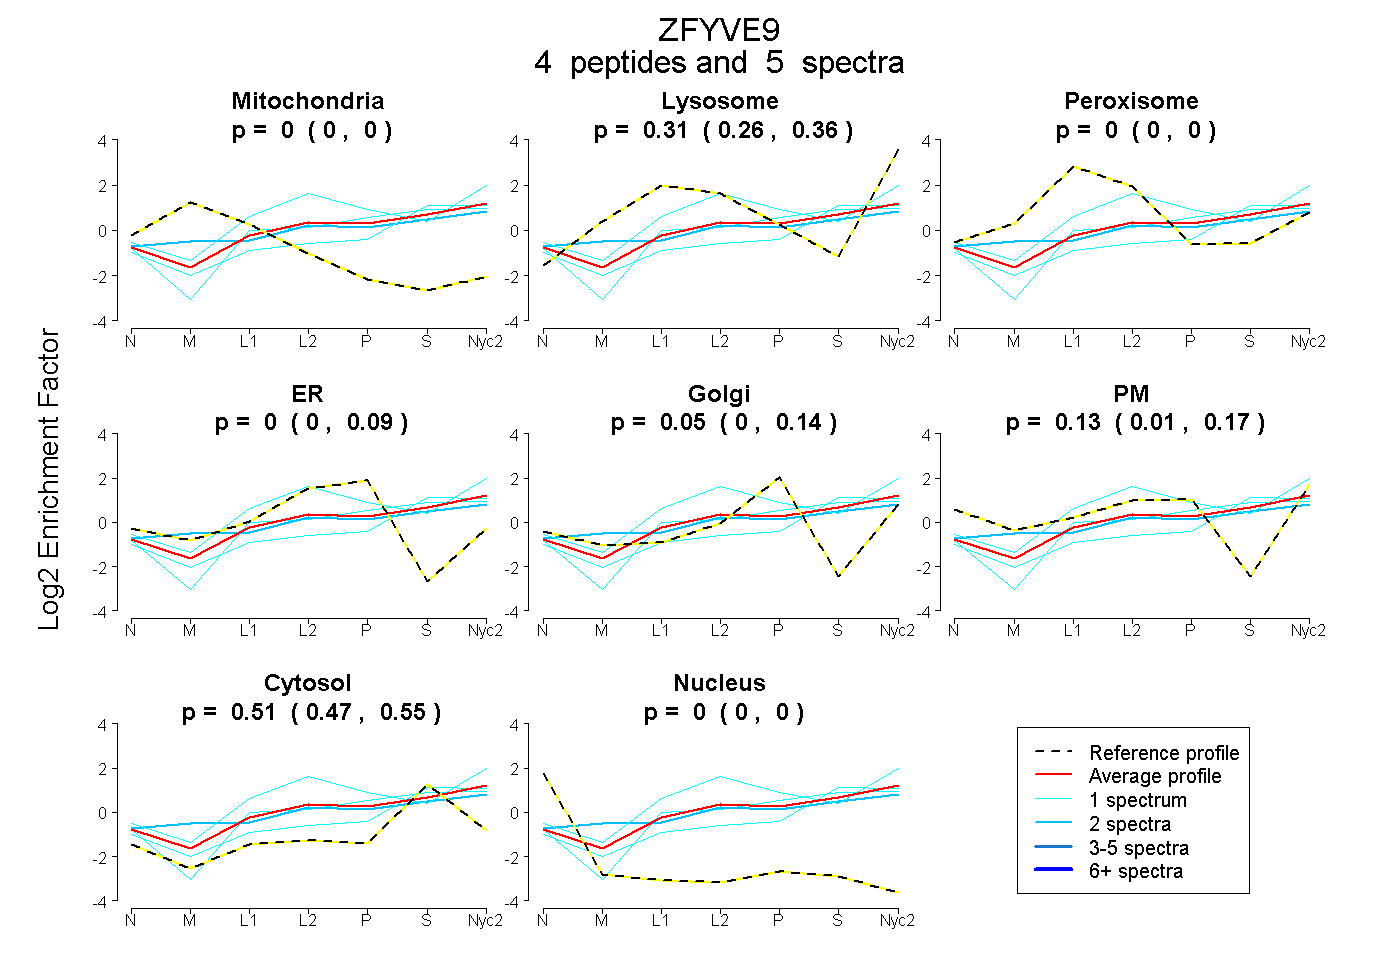
| Plot | Mito | Lyso | Perox | ER | Golgi | PM | Cytosol | Nucleus | |||||
| Expt A |
4 peptides |
5 spectra |
|
0.000 0.000 | 0.000 |
0.311 0.263 | 0.358 |
0.000 0.000 | 0.001 |
0.000 0.000 | 0.087 |
0.051 0.000 | 0.143 |
0.125 0.008 | 0.172 |
0.512 0.466 | 0.549 |
0.000 0.000 | 0.000 |
| 2 spectra, DIFNHFVQLYR | 0.000 | 0.239 | 0.061 | 0.000 | 0.058 | 0.169 | 0.473 | 0.000 | ||
| 1 spectrum, LNEVDDR | 0.000 | 0.255 | 0.000 | 0.000 | 0.042 | 0.000 | 0.702 | 0.000 | ||
| 1 spectrum, WTEVFFLENDDHR | 0.000 | 0.510 | 0.012 | 0.156 | 0.000 | 0.048 | 0.274 | 0.000 | ||
| 1 spectrum, AGQFGISAR | 0.000 | 0.251 | 0.000 | 0.040 | 0.121 | 0.000 | 0.588 | 0.000 |
| Plot | Mito | Lyso or Perox | ER | Golgi | PM | Cytosol | Nucleus | ||||||
| Expt B |
1 peptide |
1 spectrum |
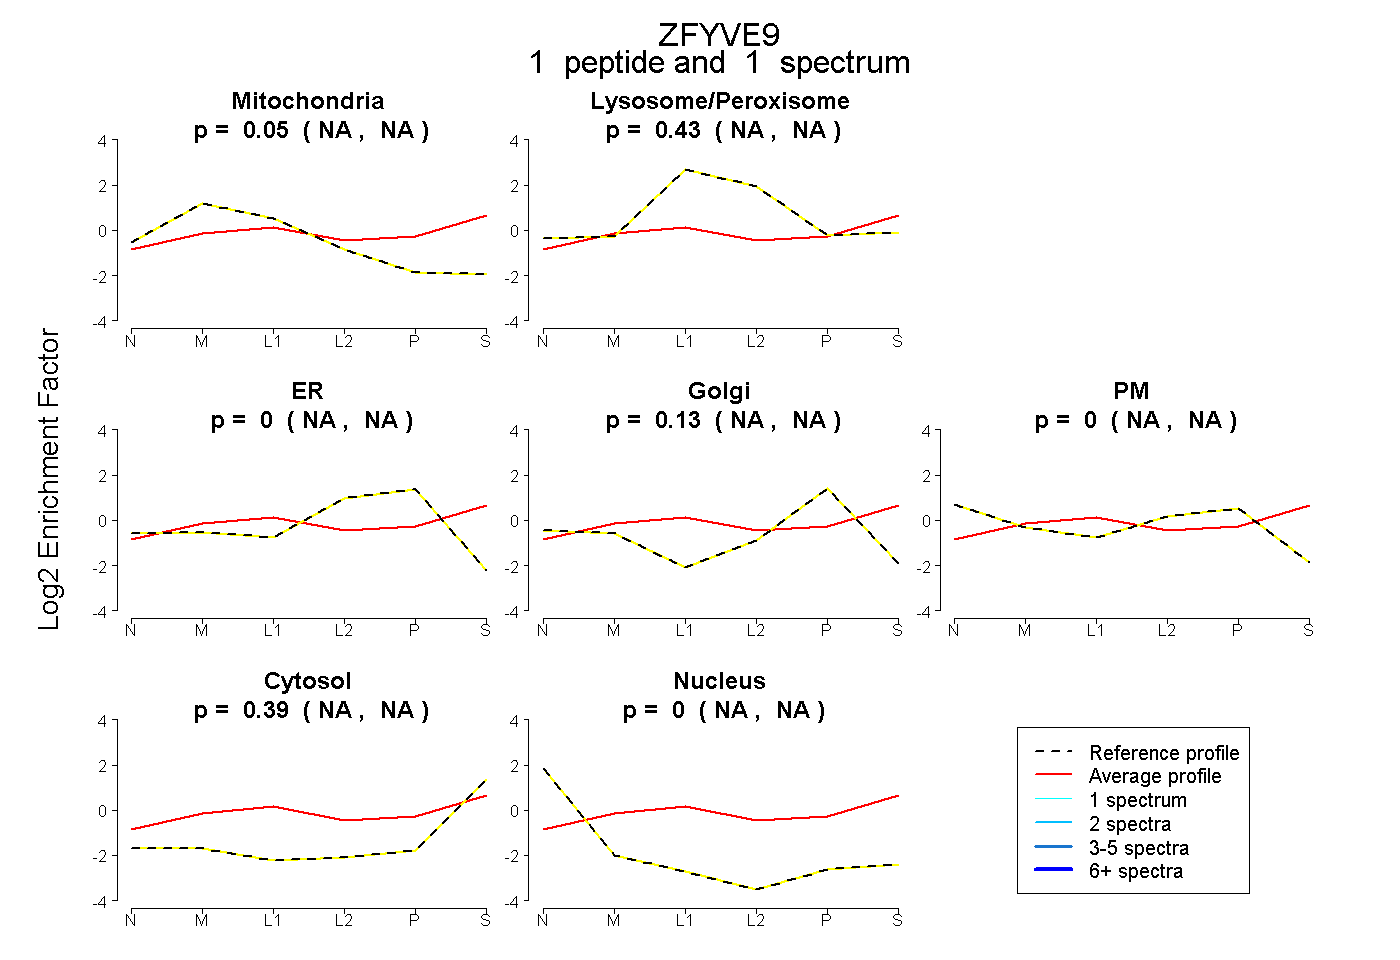 |
0.049 NA | NA |
0.430 NA | NA |
0.000 NA | NA |
0.135 NA | NA |
0.000 NA | NA |
0.386 NA | NA |
0.000 NA | NA |
|||
| Plot | Lyso | Other | |||||||||||
| Expt C |
4 peptides |
7 spectra |
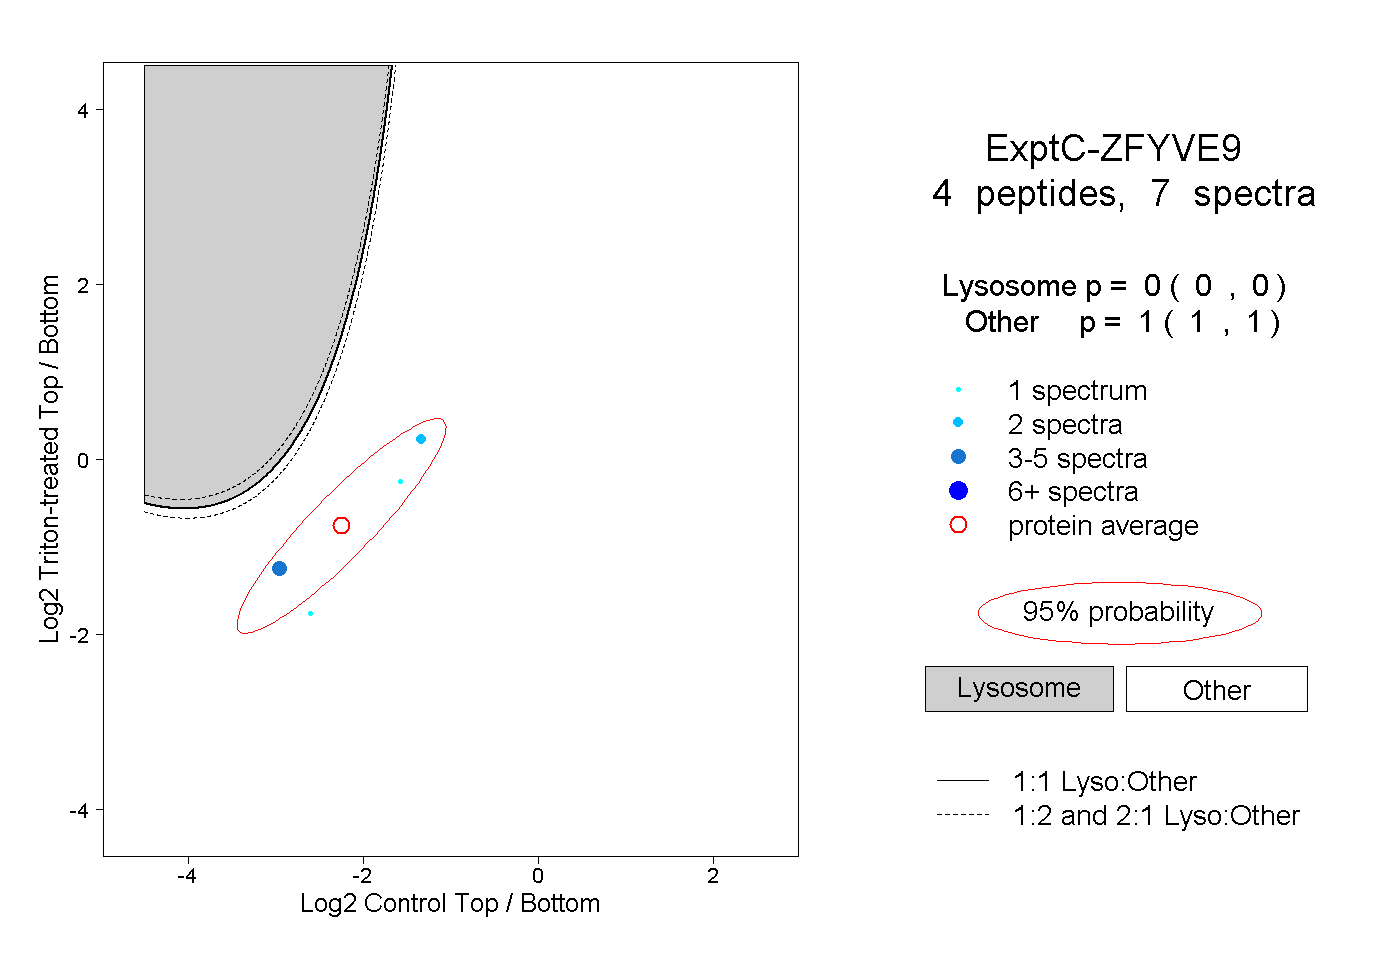 |
0.000 0.000 | 0.000 |
1.000 1.000 | 1.000 |