 8
8peptides
spectra
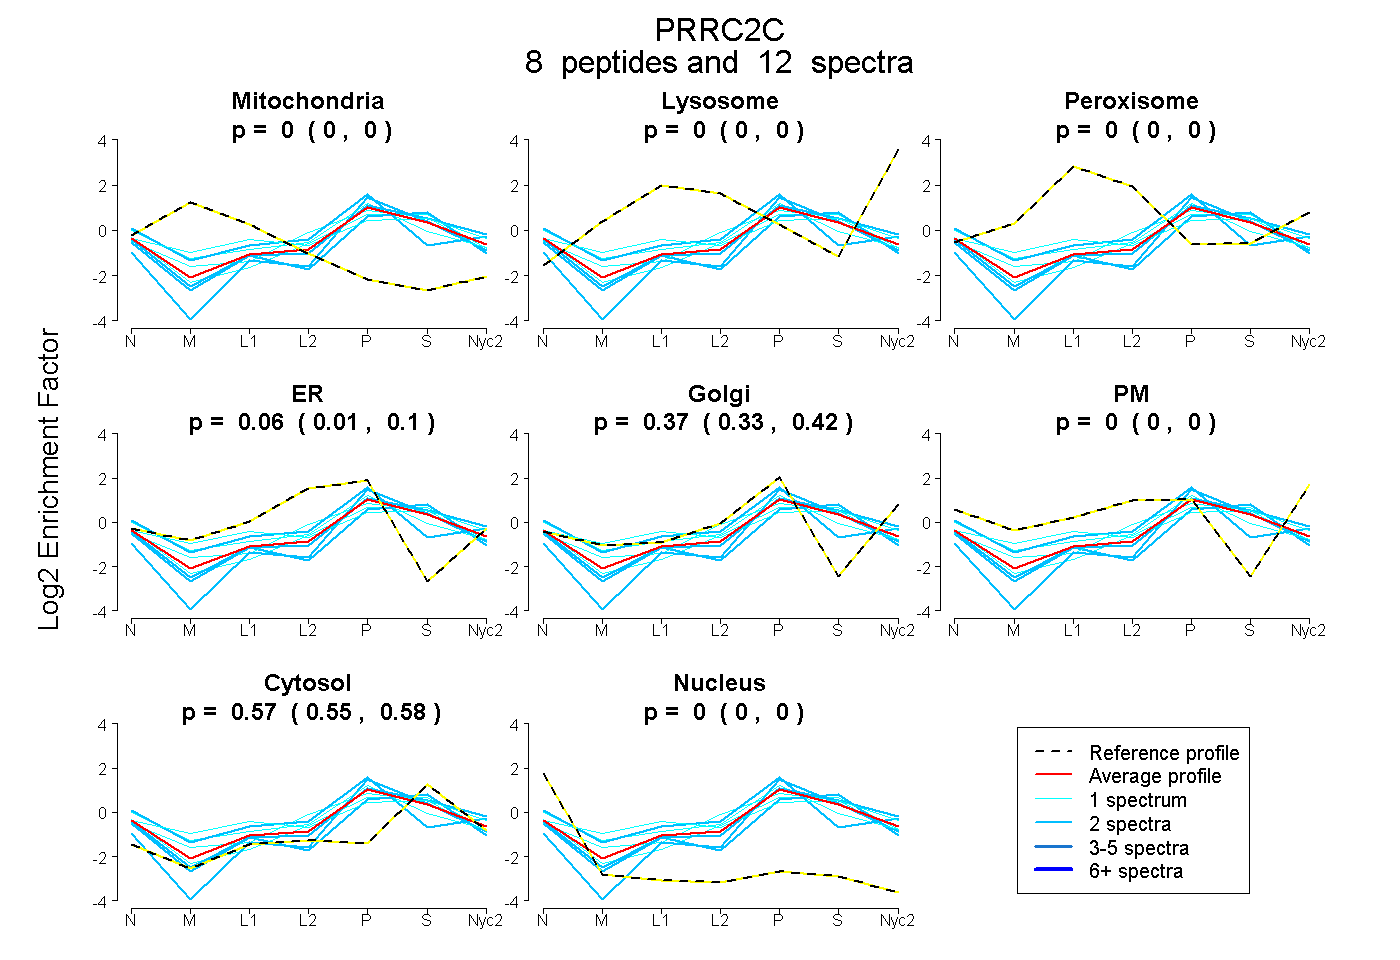
0.000 | 0.000
0.000 | 0.000
0.000 | 0.000
0.015 | 0.098
0.325 | 0.416
0.000 | 0.000
0.549 | 0.583
0.000 | 0.000
3peptides
spectra
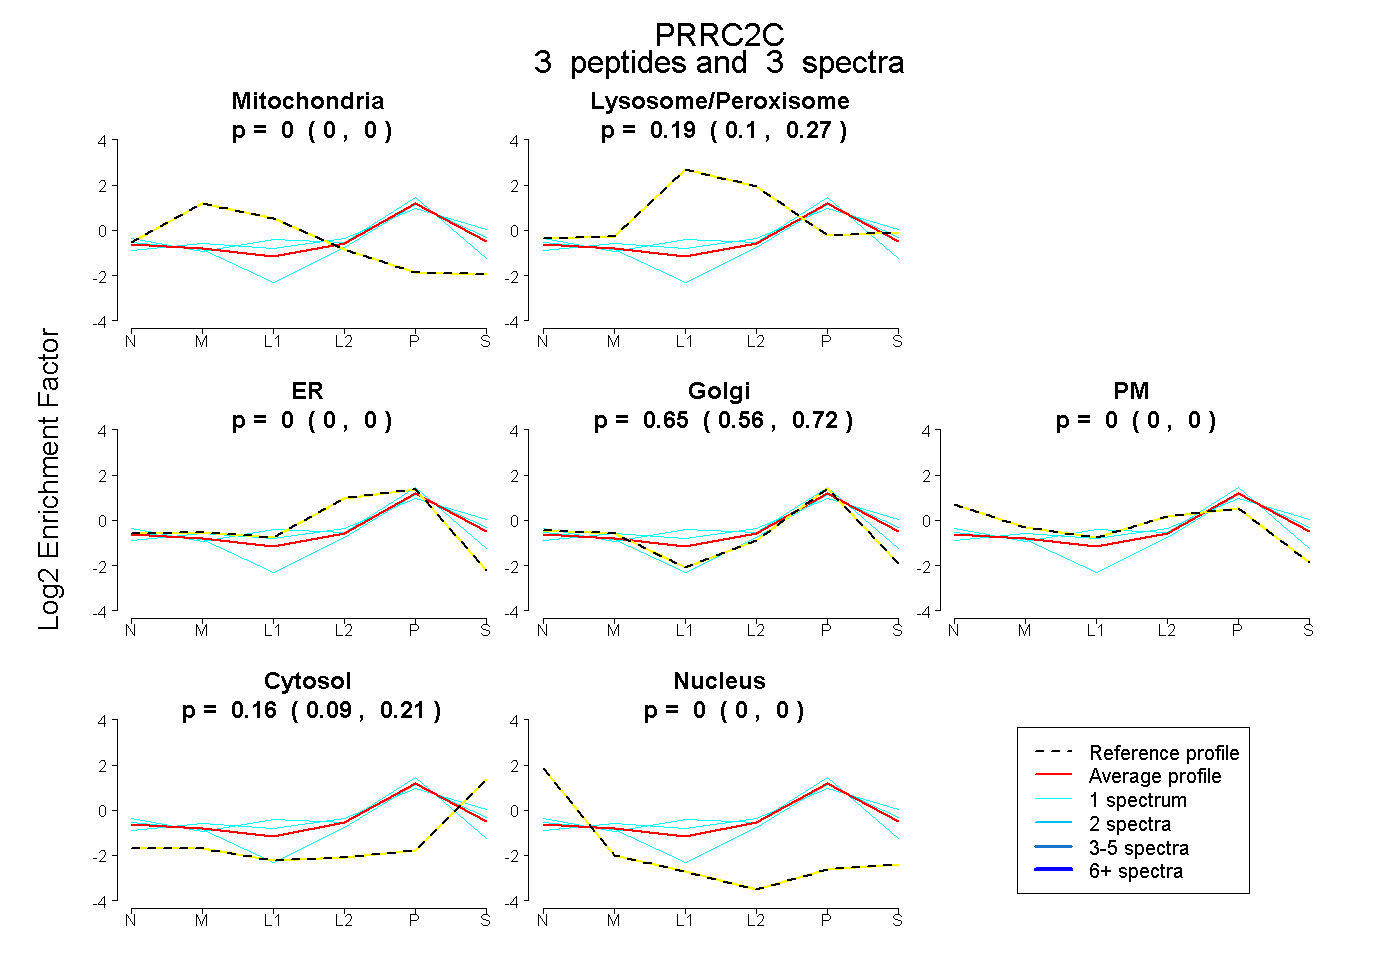
0.000 | 0.000
0.095 | 0.269
0.000 | 0.000
0.558 | 0.720
0.000 | 0.000
0.087 | 0.214
0.000 | 0.000
12peptides
spectra
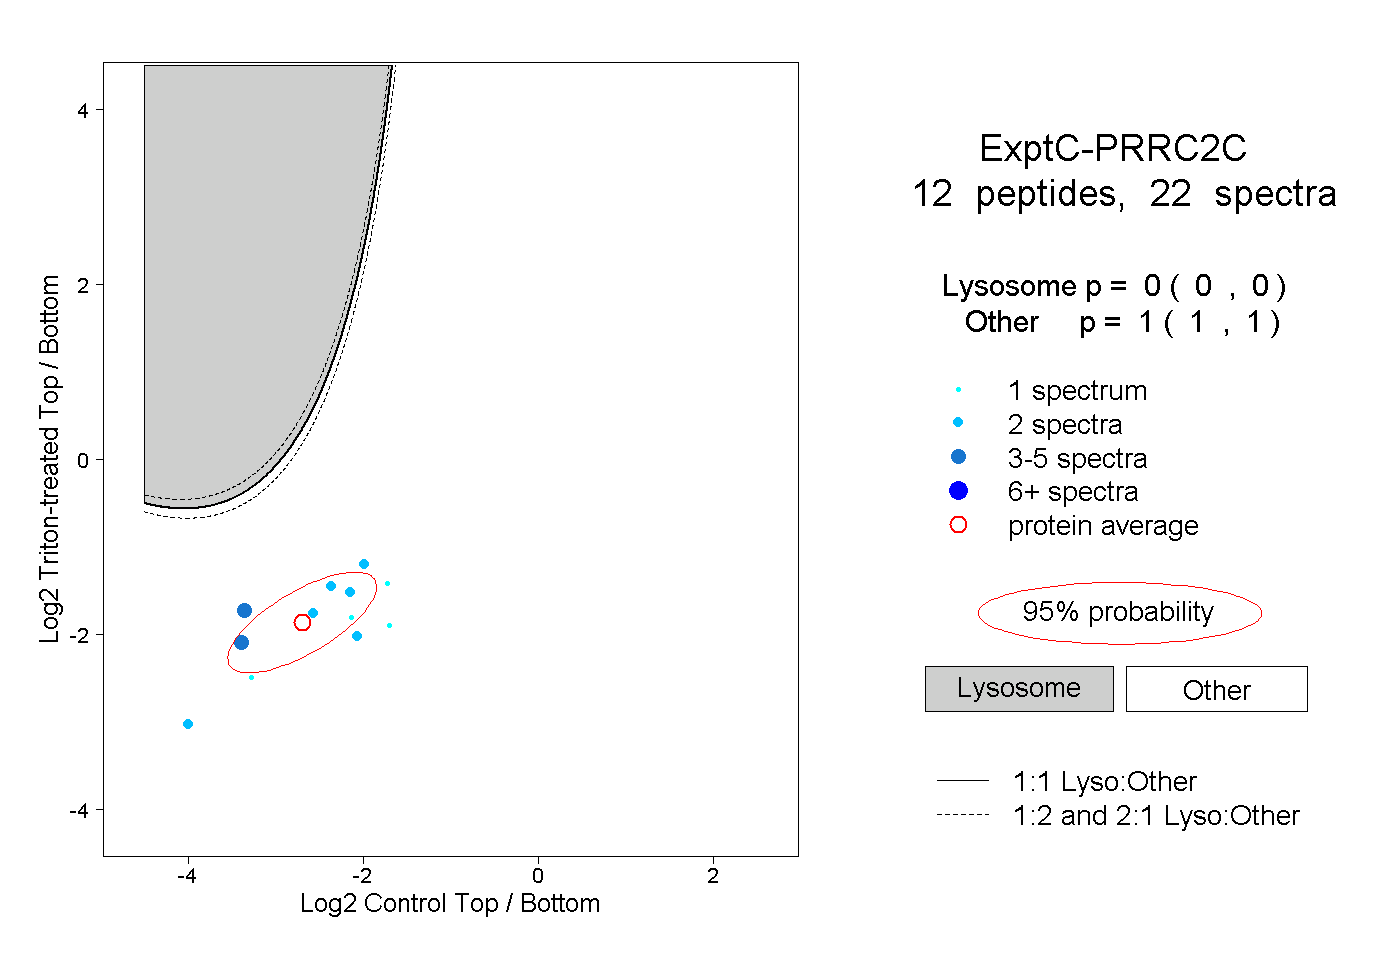
0.000 | 0.000
1.000 | 1.000
1peptide
spectrum
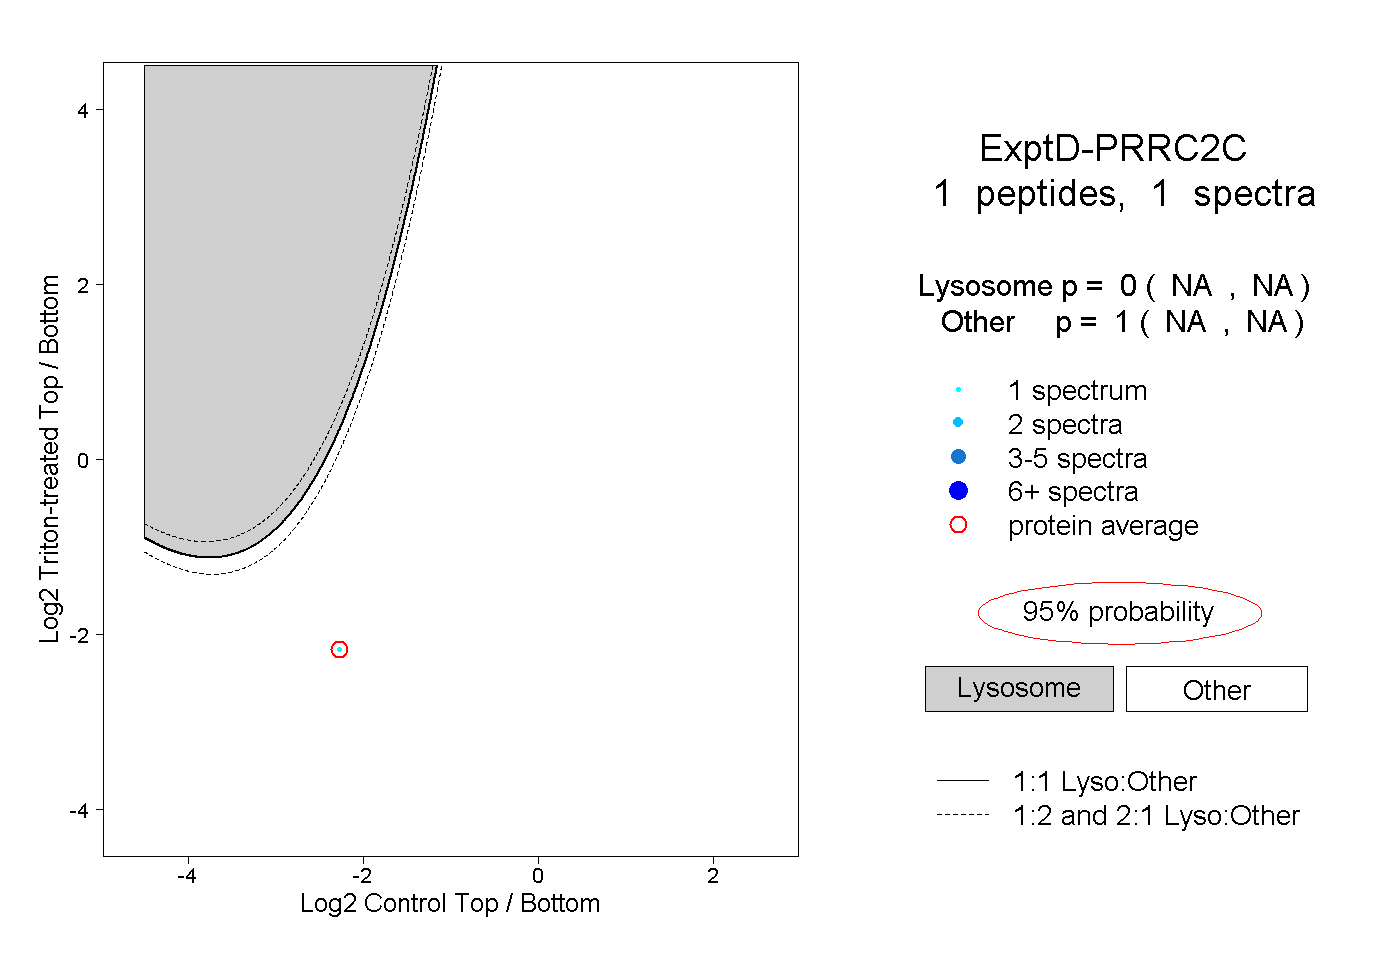
NA | NA
NA | NA