 8
8peptides
spectra
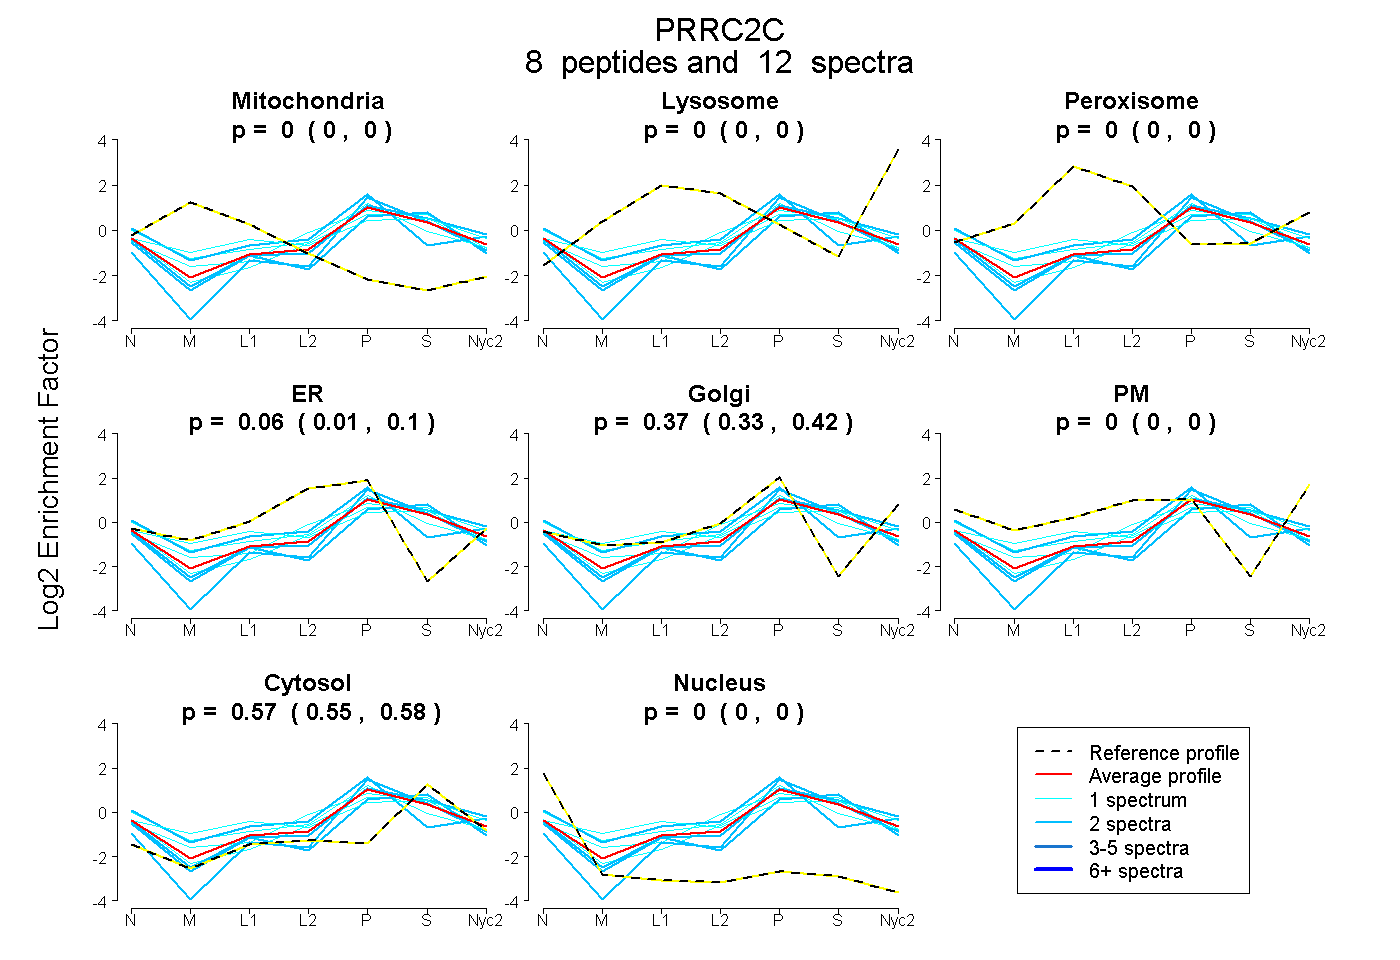
0.000 | 0.000
0.000 | 0.000
0.000 | 0.000
0.015 | 0.098
0.325 | 0.416
0.000 | 0.000
0.549 | 0.583
0.000 | 0.000
| Plot | Mito | Lyso | Perox | ER | Golgi | PM | Cytosol | Nucleus | |||||
| Expt A |
8 peptides |
12 spectra |
|
0.000 0.000 | 0.000 |
0.000 0.000 | 0.000 |
0.000 0.000 | 0.000 |
0.059 0.015 | 0.098 |
0.374 0.325 | 0.416 |
0.000 0.000 | 0.000 |
0.567 0.549 | 0.583 |
0.000 0.000 | 0.000 |
| 1 spectrum, EGDEASSTK | 0.000 | 0.000 | 0.000 | 0.076 | 0.266 | 0.000 | 0.654 | 0.003 | ||
| 1 spectrum, QPPPSIR | 0.000 | 0.000 | 0.000 | 0.257 | 0.286 | 0.000 | 0.444 | 0.014 | ||
| 2 spectra, LPDLSLVENK | 0.000 | 0.000 | 0.000 | 0.000 | 0.330 | 0.000 | 0.662 | 0.008 | ||
| 1 spectrum, LGLLEK | 0.000 | 0.000 | 0.000 | 0.334 | 0.073 | 0.000 | 0.593 | 0.000 | ||
| 1 spectrum, SWASNK | 0.001 | 0.000 | 0.184 | 0.000 | 0.303 | 0.000 | 0.512 | 0.000 | ||
| 2 spectra, GPPFSQER | 0.000 | 0.000 | 0.000 | 0.000 | 0.248 | 0.000 | 0.713 | 0.039 | ||
| 2 spectra, SLPTPTDER | 0.000 | 0.000 | 0.000 | 0.000 | 0.417 | 0.000 | 0.583 | 0.000 | ||
| 2 spectra, SFSSQRPGVDR | 0.000 | 0.000 | 0.000 | 0.197 | 0.490 | 0.000 | 0.307 | 0.006 |
| Plot | Mito | Lyso or Perox | ER | Golgi | PM | Cytosol | Nucleus | ||||||
| Expt B |
3 peptides |
3 spectra |
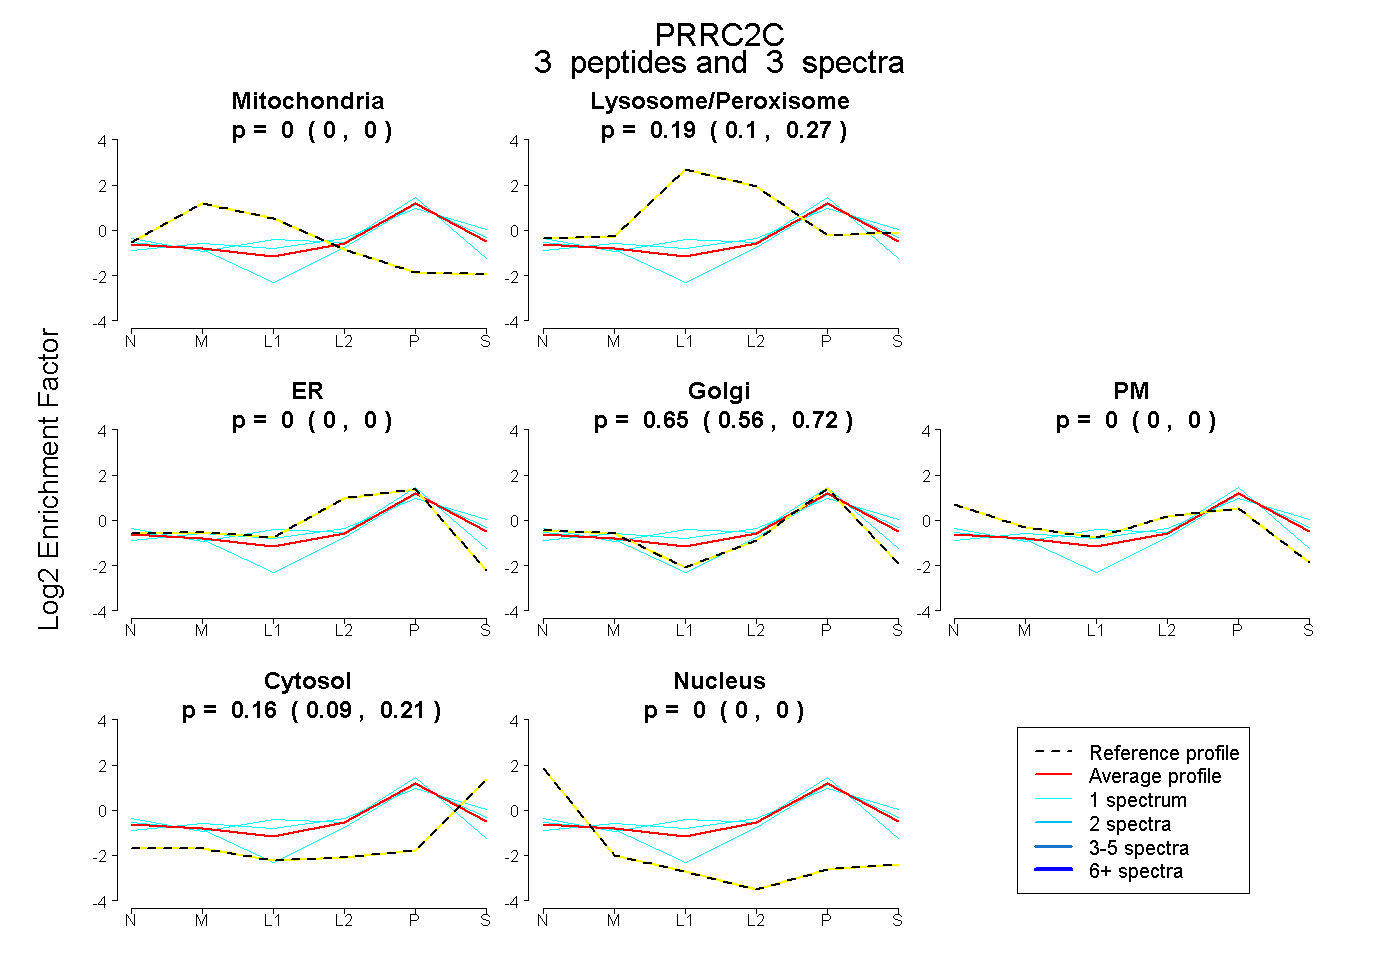 |
0.000 0.000 | 0.000 |
0.192 0.095 | 0.269 |
0.000 0.000 | 0.000 |
0.651 0.558 | 0.720 |
0.000 0.000 | 0.000 |
0.158 0.087 | 0.214 |
0.000 0.000 | 0.000 |
|||
| Plot | Lyso | Other | |||||||||||
| Expt C |
12 peptides |
22 spectra |
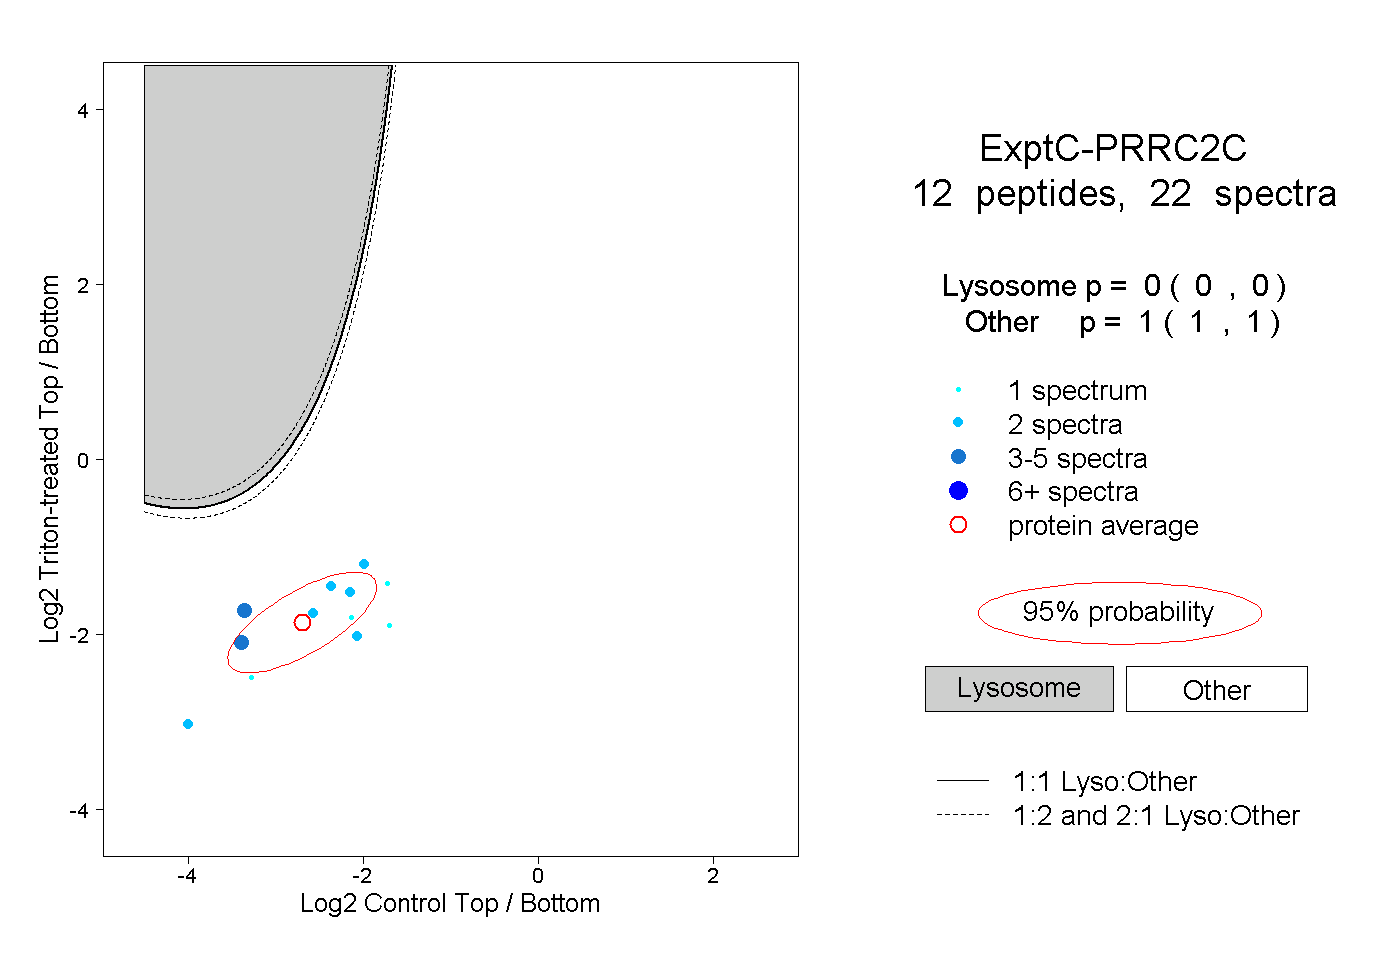 |
0.000 0.000 | 0.000 |
1.000 1.000 | 1.000 |
||||||||
| Plot | Lyso | Other | |||||||||||
| Expt D |
1 peptide |
1 spectrum |
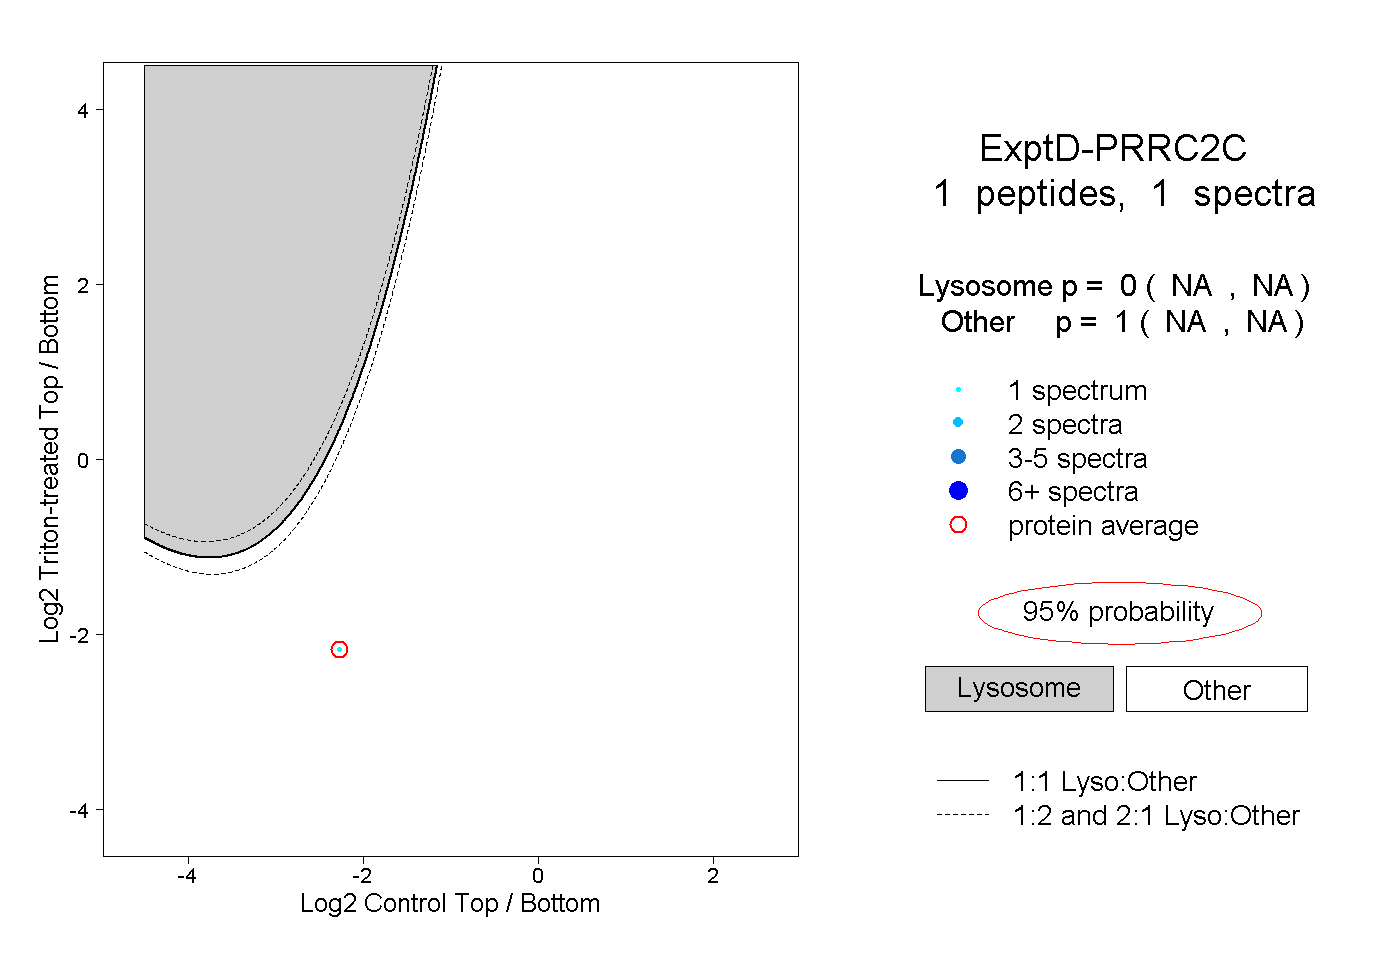 |
0.000 NA | NA |
1.000 NA | NA |