 24
24peptides
spectra
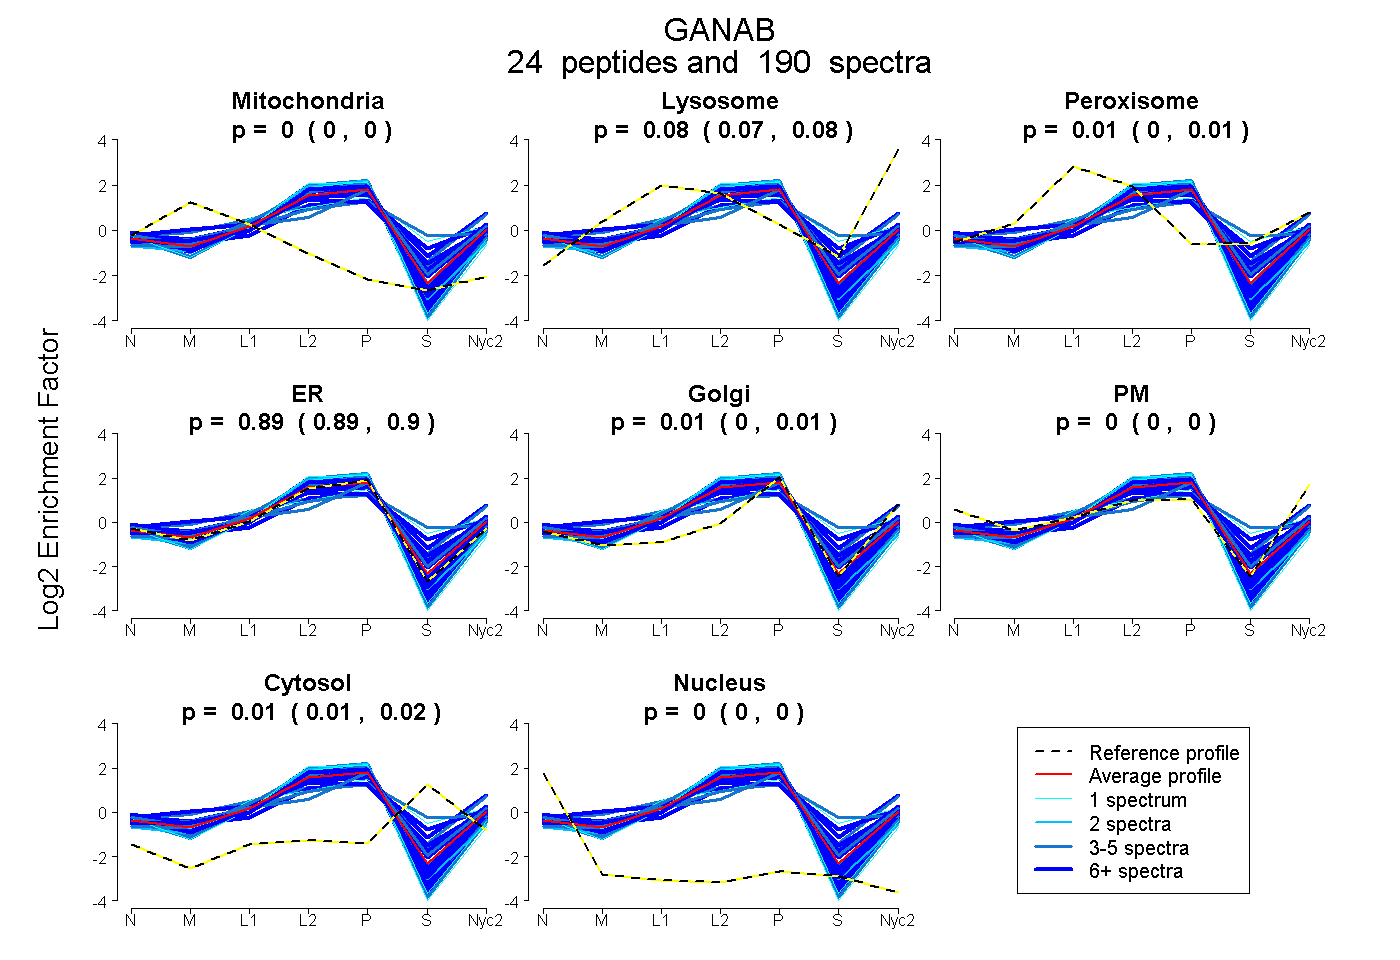
0.000 | 0.000
0.074 | 0.082
0.002 | 0.011
0.886 | 0.901
0.000 | 0.014
0.000 | 0.003
0.009 | 0.016
0.000 | 0.000
19peptides
spectra
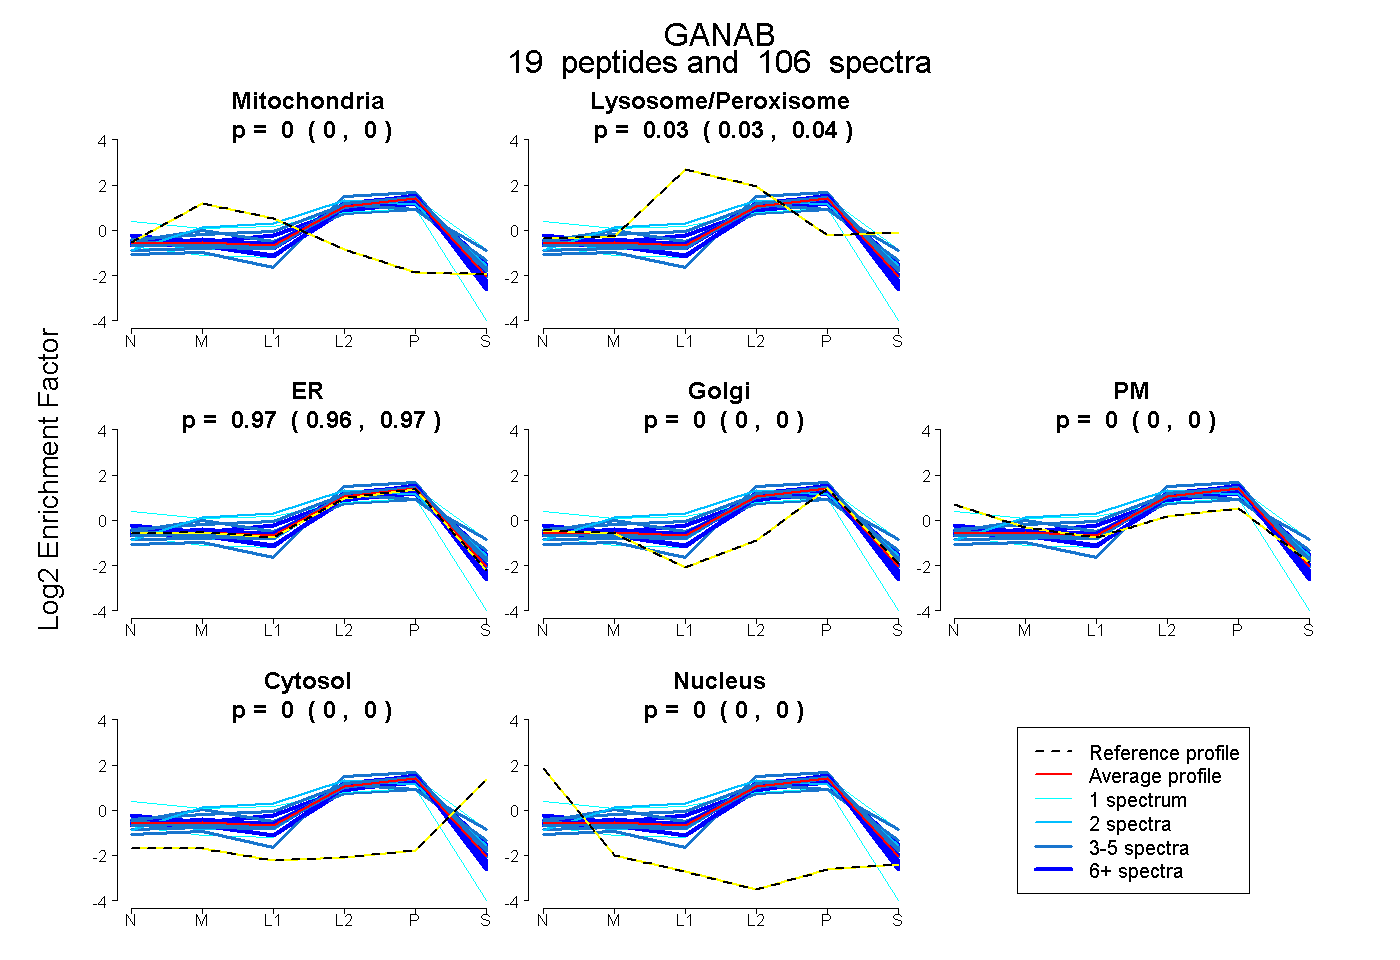
0.000 | 0.000
0.030 | 0.038
0.956 | 0.969
0.000 | 0.004
0.000 | 0.000
0.000 | 0.002
0.000 | 0.000
23peptides
spectra
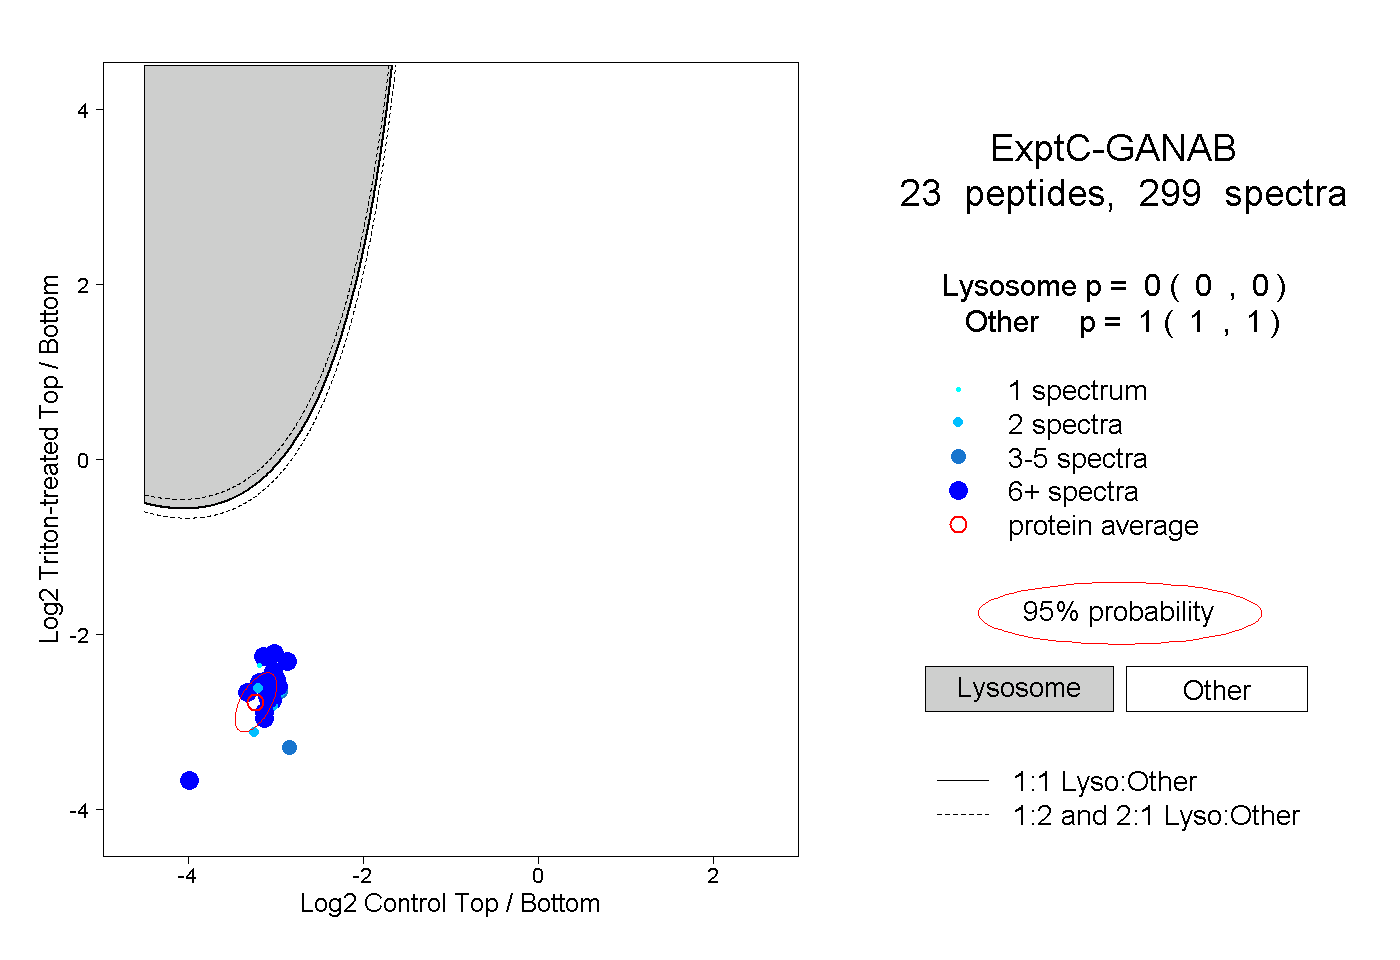
0.000 | 0.000
1.000 | 1.000
13peptides
spectra
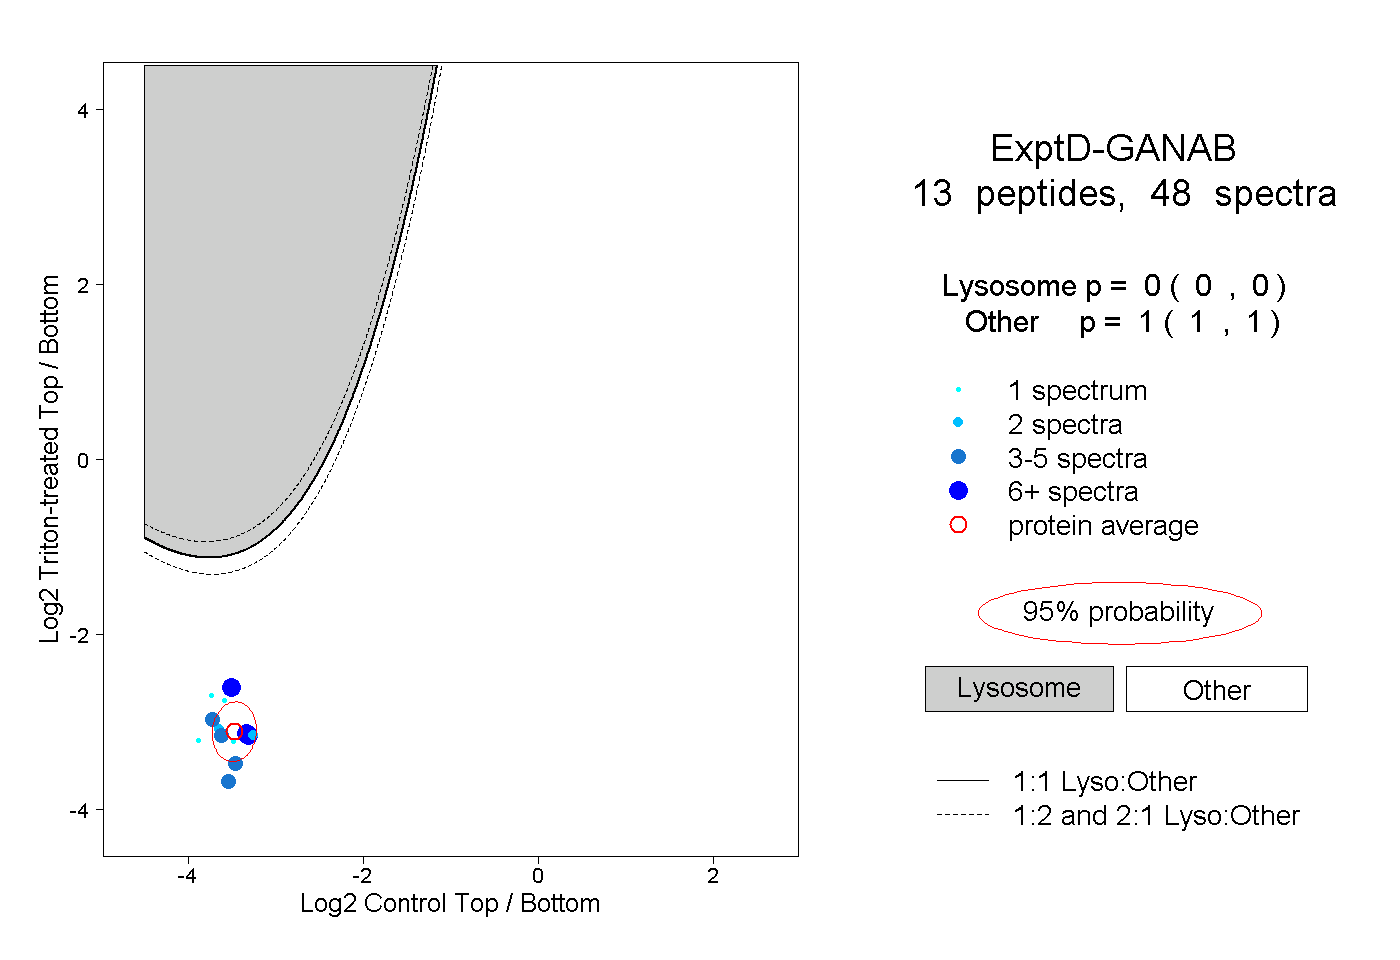
0.000 | 0.000
1.000 | 1.000