 24
24peptides
spectra
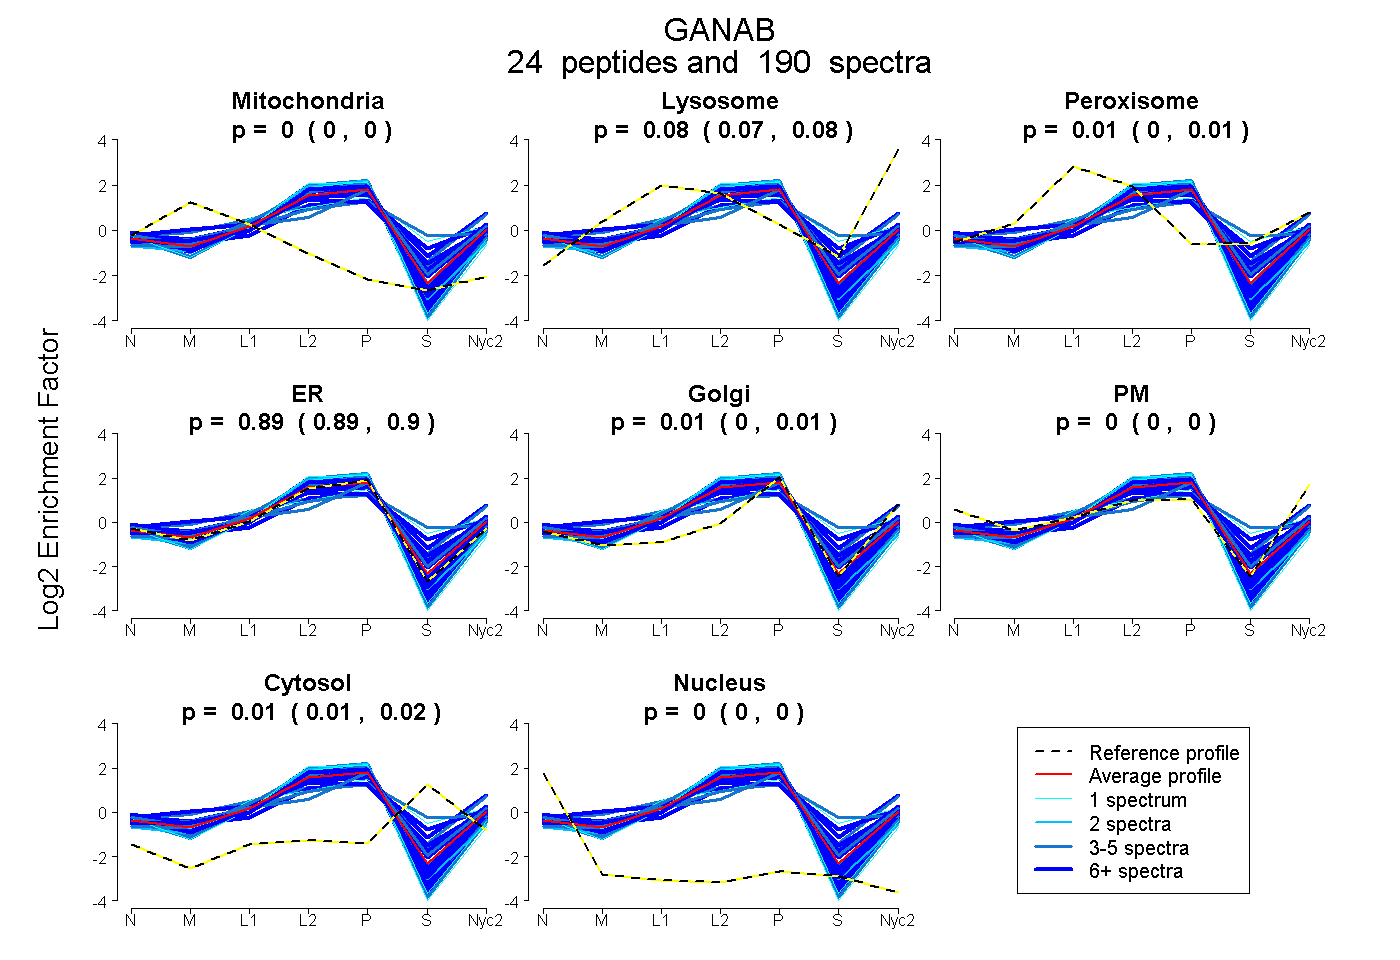
0.000 | 0.000
0.074 | 0.082
0.002 | 0.011
0.886 | 0.901
0.000 | 0.014
0.000 | 0.003
0.009 | 0.016
0.000 | 0.000
| Plot | Mito | Lyso | Perox | ER | Golgi | PM | Cytosol | Nucleus | |||||
| Expt A |
24 peptides |
190 spectra |
|
0.000 0.000 | 0.000 |
0.078 0.074 | 0.082 |
0.007 0.002 | 0.011 |
0.895 0.886 | 0.901 |
0.007 0.000 | 0.014 |
0.000 0.000 | 0.003 |
0.013 0.009 | 0.016 |
0.000 0.000 | 0.000 |
| 4 spectra, LVAIVDPHIK | 0.000 | 0.000 | 0.000 | 1.000 | 0.000 | 0.000 | 0.000 | 0.000 | ||
| 16 spectra, HEFLLR | 0.000 | 0.009 | 0.000 | 0.980 | 0.000 | 0.011 | 0.000 | 0.000 | ||
| 3 spectra, EPWLLASQYQDAIR | 0.000 | 0.000 | 0.000 | 1.000 | 0.000 | 0.000 | 0.000 | 0.000 | ||
| 6 spectra, YFTWDPTR | 0.000 | 0.052 | 0.000 | 0.948 | 0.000 | 0.000 | 0.000 | 0.000 | ||
| 10 spectra, AHAHLDTGR | 0.000 | 0.212 | 0.000 | 0.574 | 0.000 | 0.094 | 0.120 | 0.000 | ||
| 10 spectra, NPEPELLVR | 0.000 | 0.034 | 0.000 | 0.905 | 0.000 | 0.061 | 0.000 | 0.000 | ||
| 8 spectra, NHGLYVK | 0.028 | 0.000 | 0.258 | 0.501 | 0.150 | 0.025 | 0.038 | 0.000 | ||
| 8 spectra, GHLETPVWIER | 0.000 | 0.000 | 0.121 | 0.456 | 0.047 | 0.172 | 0.203 | 0.000 | ||
| 4 spectra, SSDCMK | 0.000 | 0.068 | 0.000 | 0.932 | 0.000 | 0.000 | 0.000 | 0.000 | ||
| 13 spectra, SGGIERPFVLSR | 0.000 | 0.087 | 0.000 | 0.882 | 0.000 | 0.000 | 0.031 | 0.000 | ||
| 1 spectrum, VHEELR | 0.000 | 0.000 | 0.000 | 1.000 | 0.000 | 0.000 | 0.000 | 0.000 | ||
| 5 spectra, DEPGAWEETFK | 0.000 | 0.087 | 0.093 | 0.764 | 0.000 | 0.000 | 0.057 | 0.000 | ||
| 6 spectra, FPQPLNMLEHLASK | 0.000 | 0.042 | 0.000 | 0.958 | 0.000 | 0.000 | 0.000 | 0.000 | ||
| 2 spectra, MLDYLQGSGETPQTDIR | 0.000 | 0.000 | 0.000 | 1.000 | 0.000 | 0.000 | 0.000 | 0.000 | ||
| 4 spectra, DIHNIYGLYVHMATADGLIQR | 0.000 | 0.020 | 0.359 | 0.151 | 0.428 | 0.043 | 0.000 | 0.000 | ||
| 4 spectra, WYQMGAYQPFFR | 0.012 | 0.000 | 0.157 | 0.350 | 0.474 | 0.000 | 0.007 | 0.000 | ||
| 31 spectra, AFFSGSQR | 0.000 | 0.000 | 0.000 | 1.000 | 0.000 | 0.000 | 0.000 | 0.000 | ||
| 10 spectra, VTEGGEPYR | 0.000 | 0.104 | 0.038 | 0.738 | 0.014 | 0.047 | 0.059 | 0.000 | ||
| 4 spectra, DAVHYGGWEHR | 0.000 | 0.069 | 0.000 | 0.849 | 0.055 | 0.010 | 0.017 | 0.000 | ||
| 11 spectra, DALFQR | 0.000 | 0.000 | 0.148 | 0.688 | 0.124 | 0.030 | 0.010 | 0.000 | ||
| 23 spectra, GGTIVPR | 0.000 | 0.001 | 0.000 | 0.999 | 0.000 | 0.000 | 0.000 | 0.000 | ||
| 1 spectrum, VVIMGAGKPAAVVLQTK | 0.000 | 0.000 | 0.000 | 1.000 | 0.000 | 0.000 | 0.000 | 0.000 | ||
| 1 spectrum, KPGVNVASDWSIHLR | 0.000 | 0.000 | 0.293 | 0.340 | 0.210 | 0.000 | 0.157 | 0.000 | ||
| 5 spectra, LSFQHDPETSVLTLR | 0.000 | 0.000 | 0.191 | 0.498 | 0.025 | 0.000 | 0.286 | 0.000 |
| Plot | Mito | Lyso or Perox | ER | Golgi | PM | Cytosol | Nucleus | ||||||
| Expt B |
19 peptides |
106 spectra |
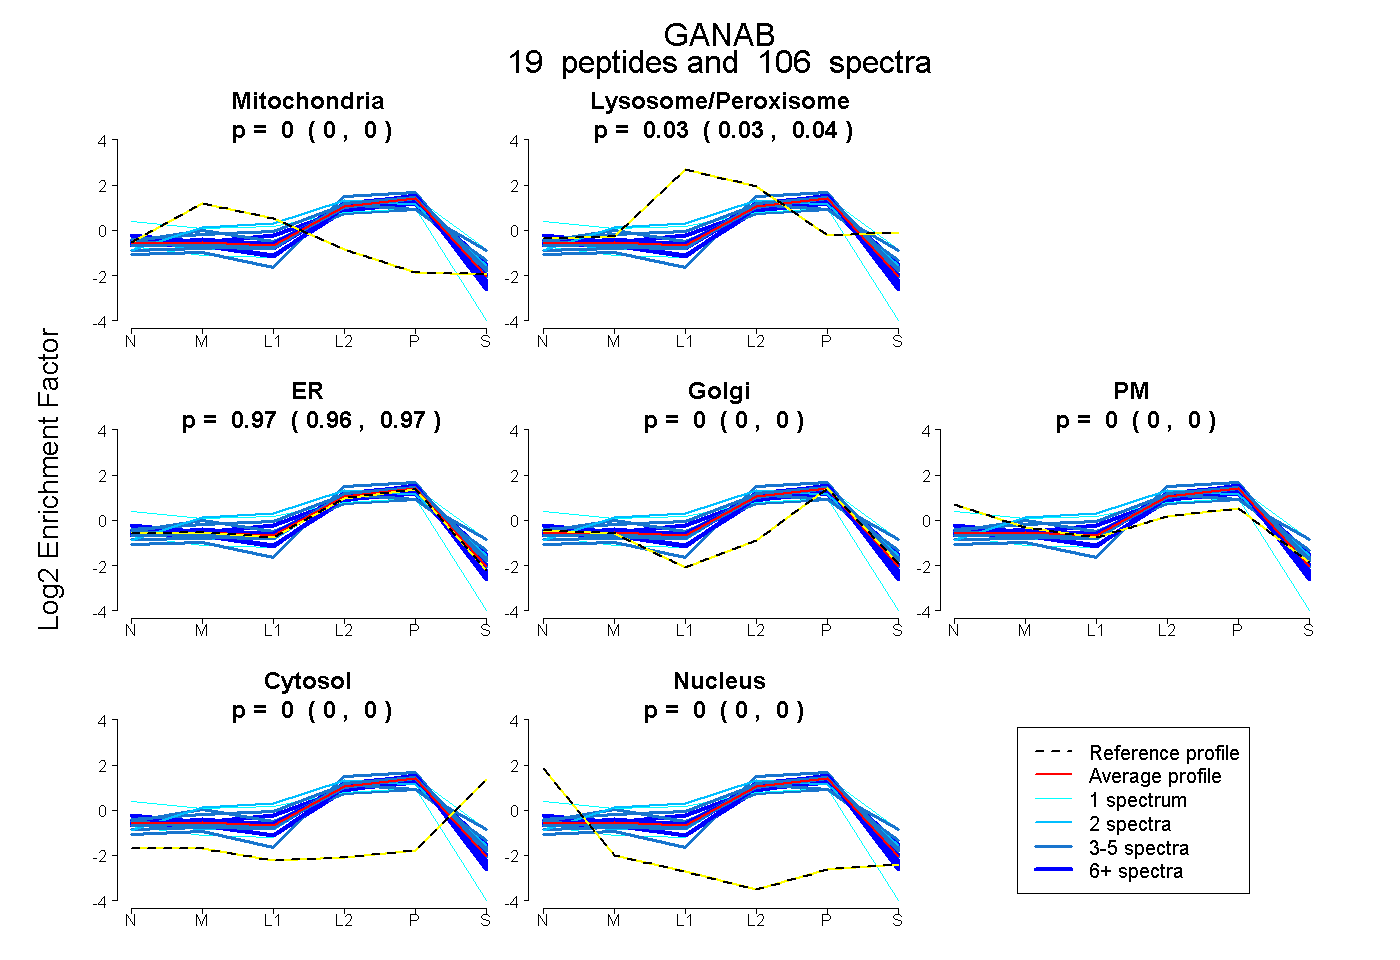 |
0.000 0.000 | 0.000 |
0.034 0.030 | 0.038 |
0.966 0.956 | 0.969 |
0.000 0.000 | 0.004 |
0.000 0.000 | 0.000 |
0.000 0.000 | 0.002 |
0.000 0.000 | 0.000 |
|||
| Plot | Lyso | Other | |||||||||||
| Expt C |
23 peptides |
299 spectra |
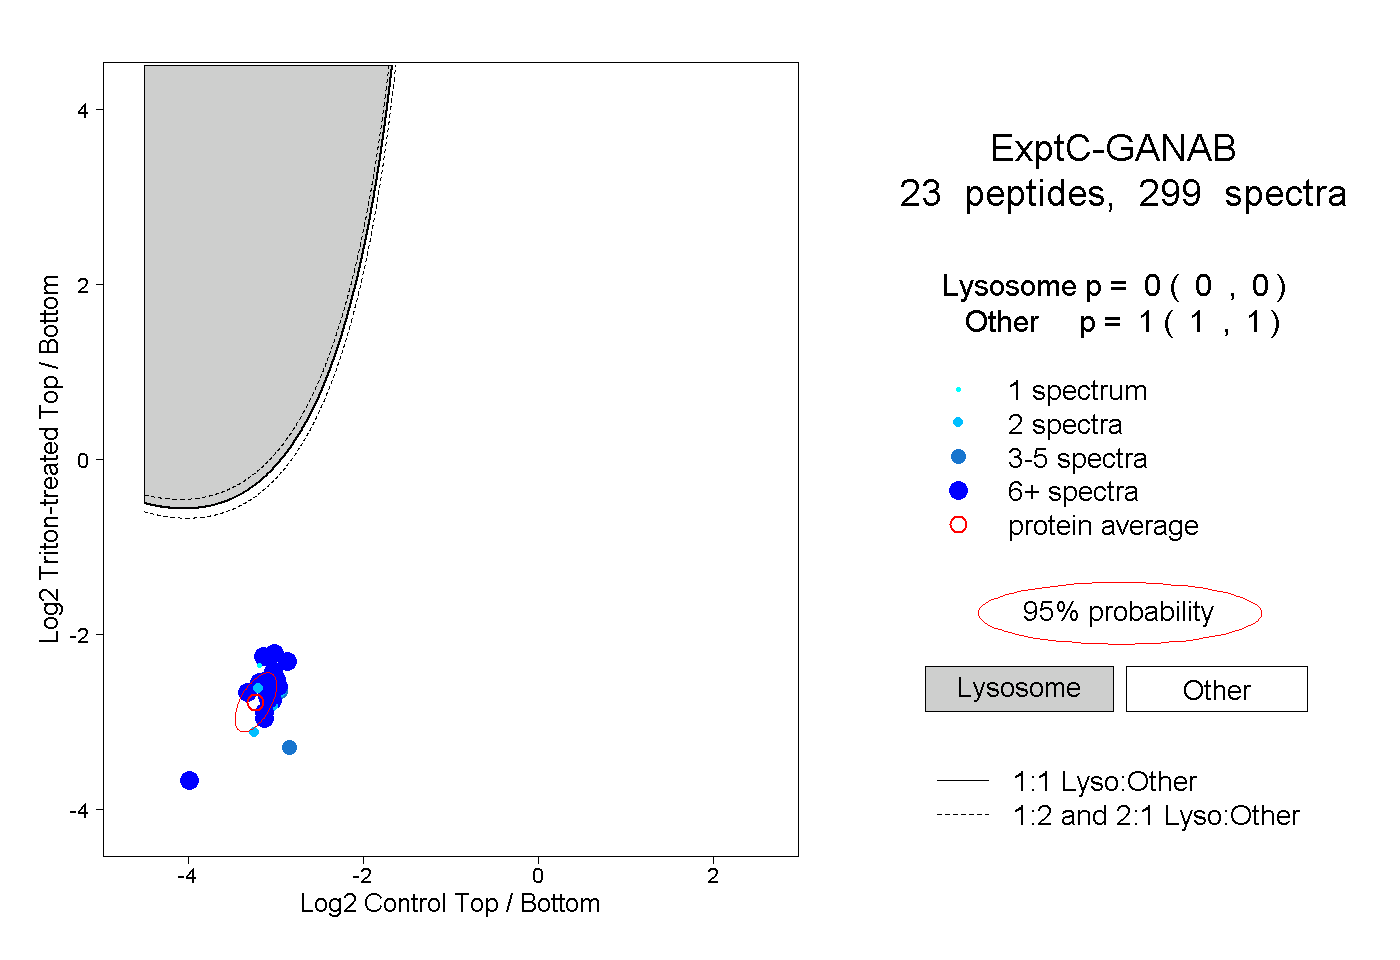 |
0.000 0.000 | 0.000 |
1.000 1.000 | 1.000 |
||||||||
| Plot | Lyso | Other | |||||||||||
| Expt D |
13 peptides |
48 spectra |
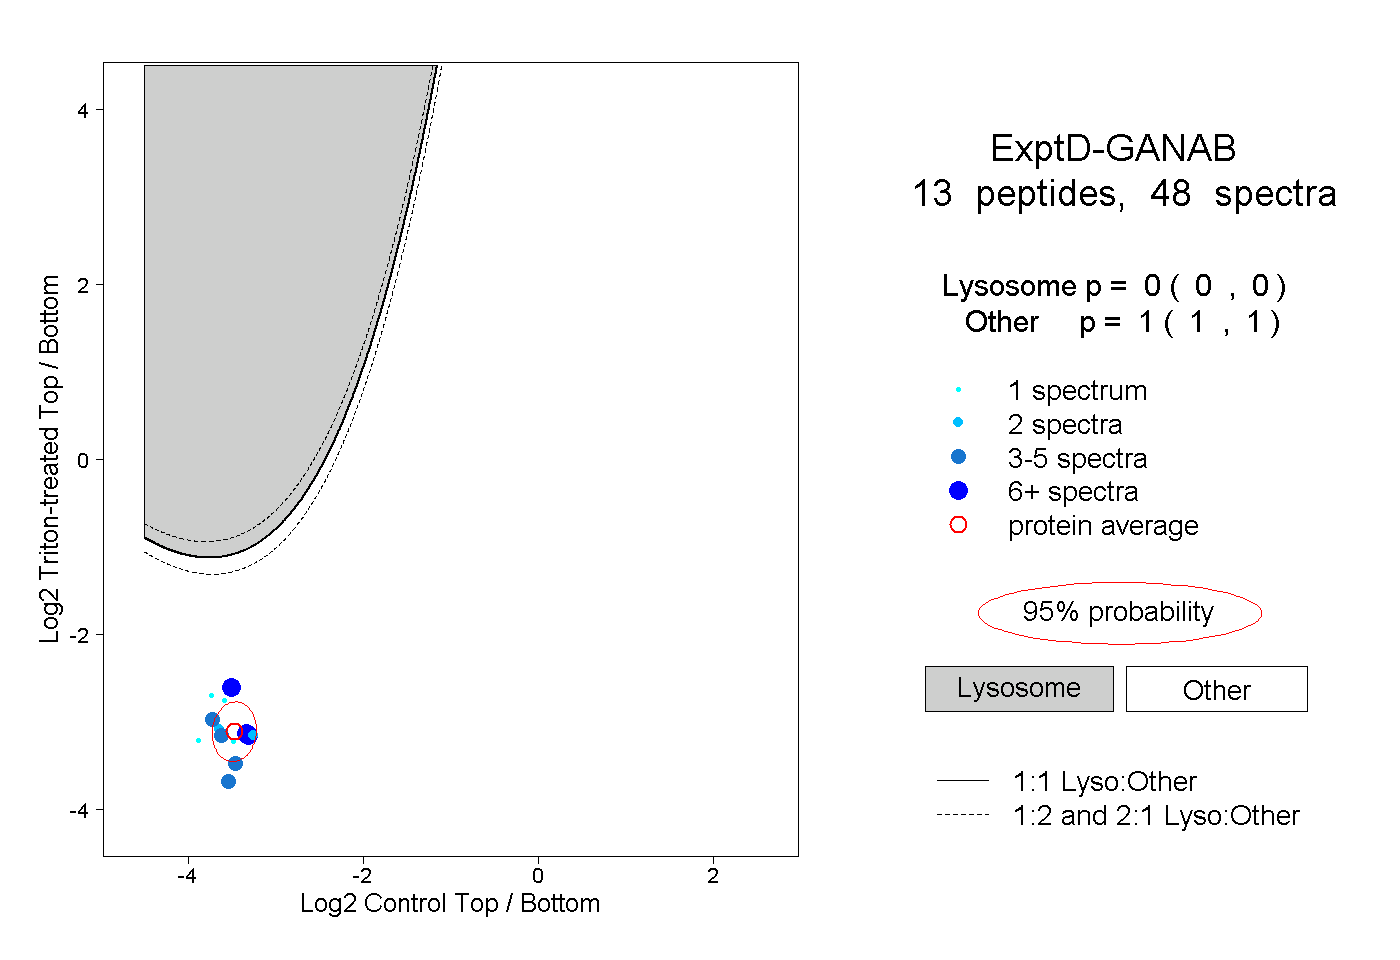 |
0.000 0.000 | 0.000 |
1.000 1.000 | 1.000 |