 5
5peptides
spectra
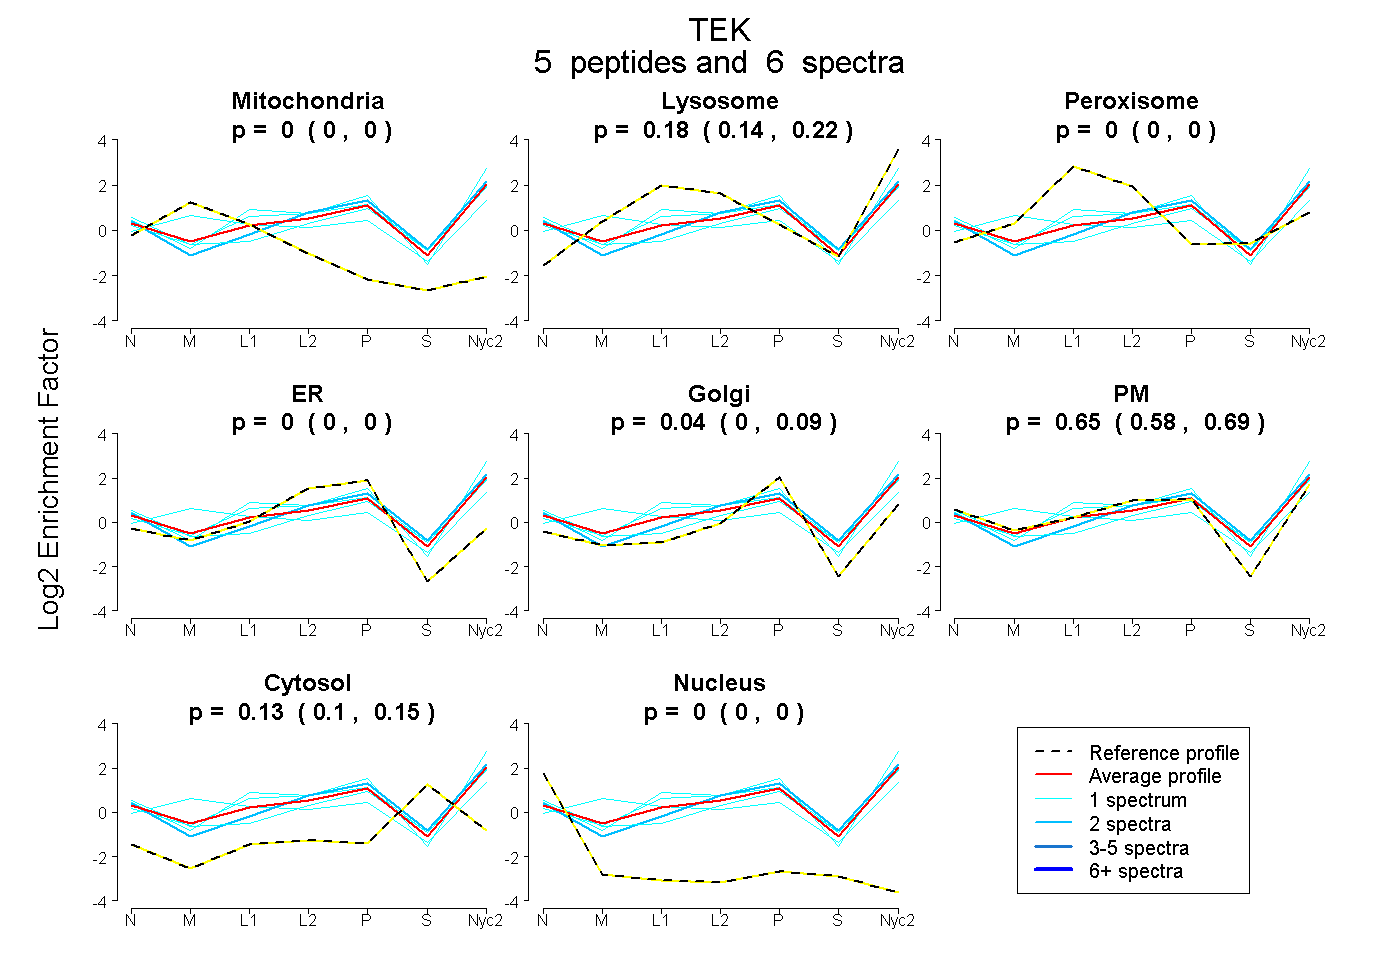
0.000 | 0.000
0.143 | 0.215
0.000 | 0.000
0.000 | 0.000
0.000 | 0.094
0.578 | 0.695
0.103 | 0.152
0.000 | 0.000
5peptides
spectra
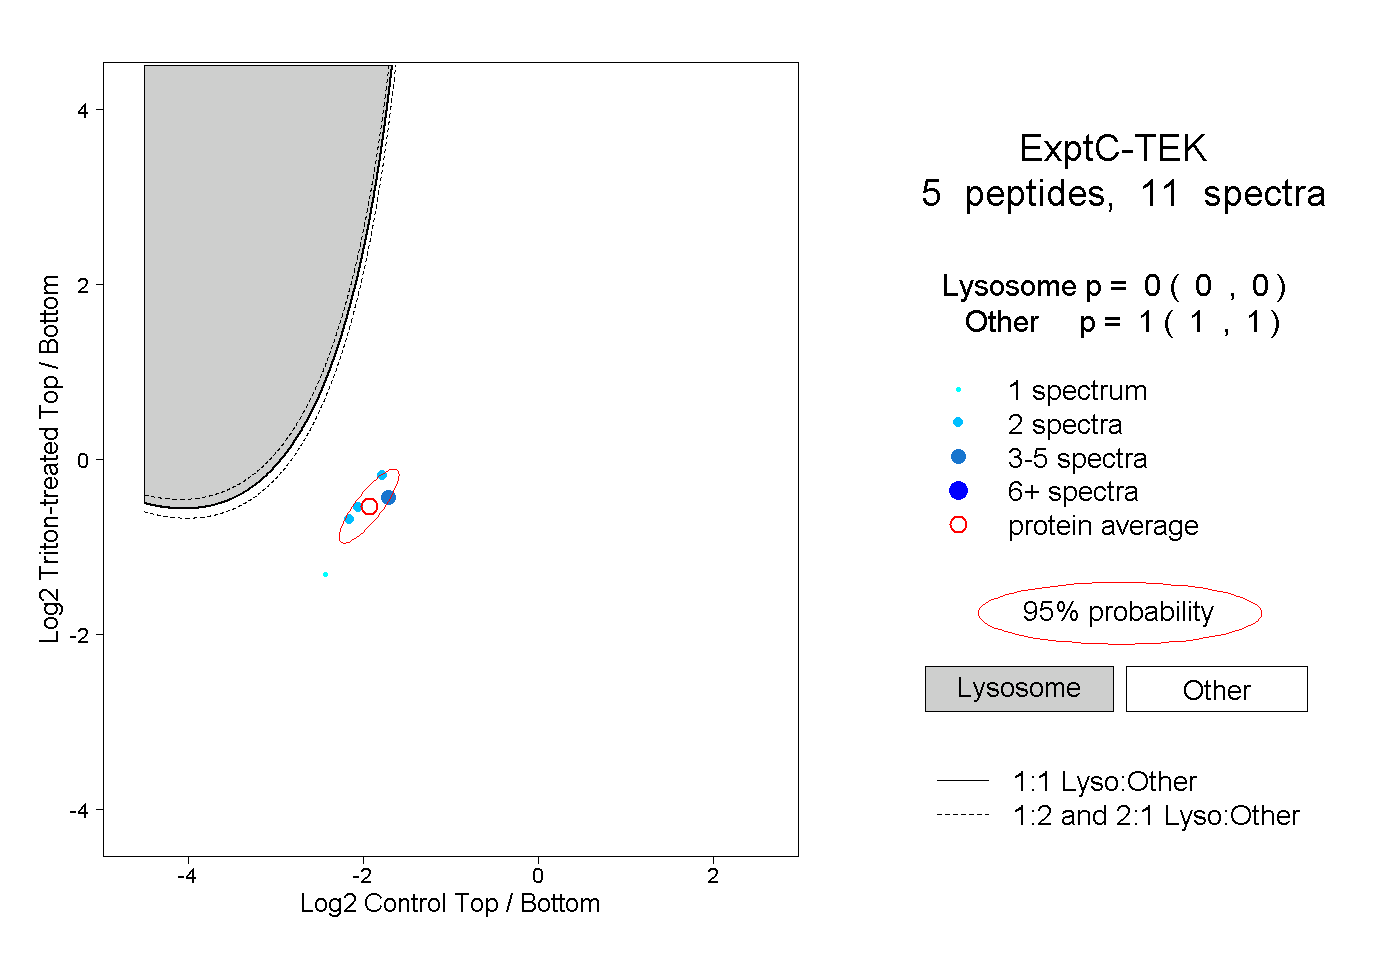
0.000 | 0.000
1.000 | 1.000
1peptide
spectrum
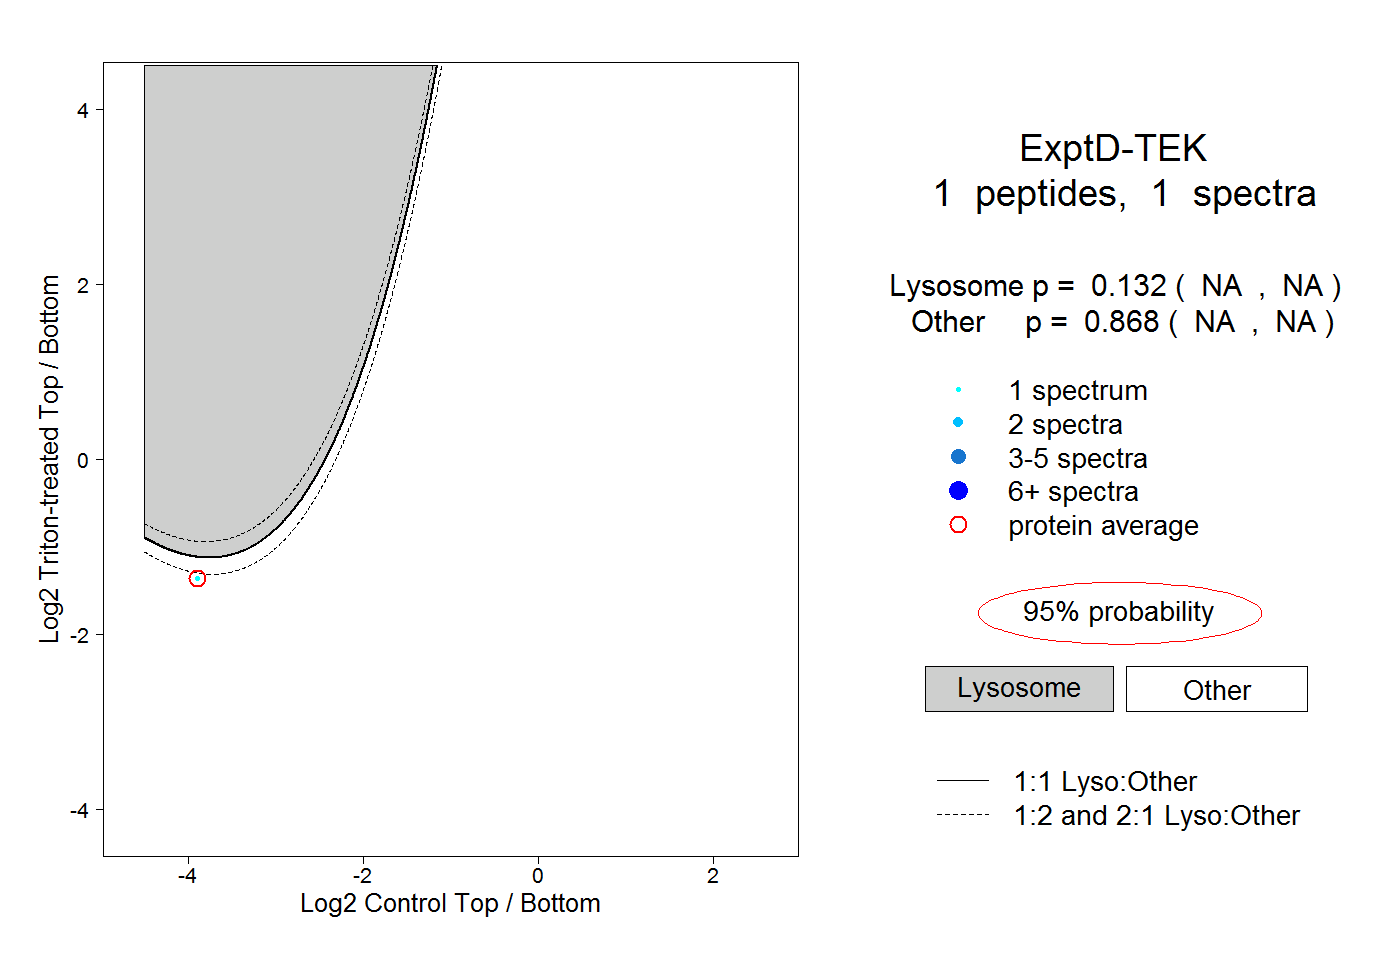
NA | NA
NA | NA