 5
5peptides
spectra
0.000 | 0.000
0.143 | 0.215
0.000 | 0.000
0.000 | 0.000
0.000 | 0.094
0.578 | 0.695
0.103 | 0.152
0.000 | 0.000
| Plot | Mito | Lyso | Perox | ER | Golgi | PM | Cytosol | Nucleus | |||||
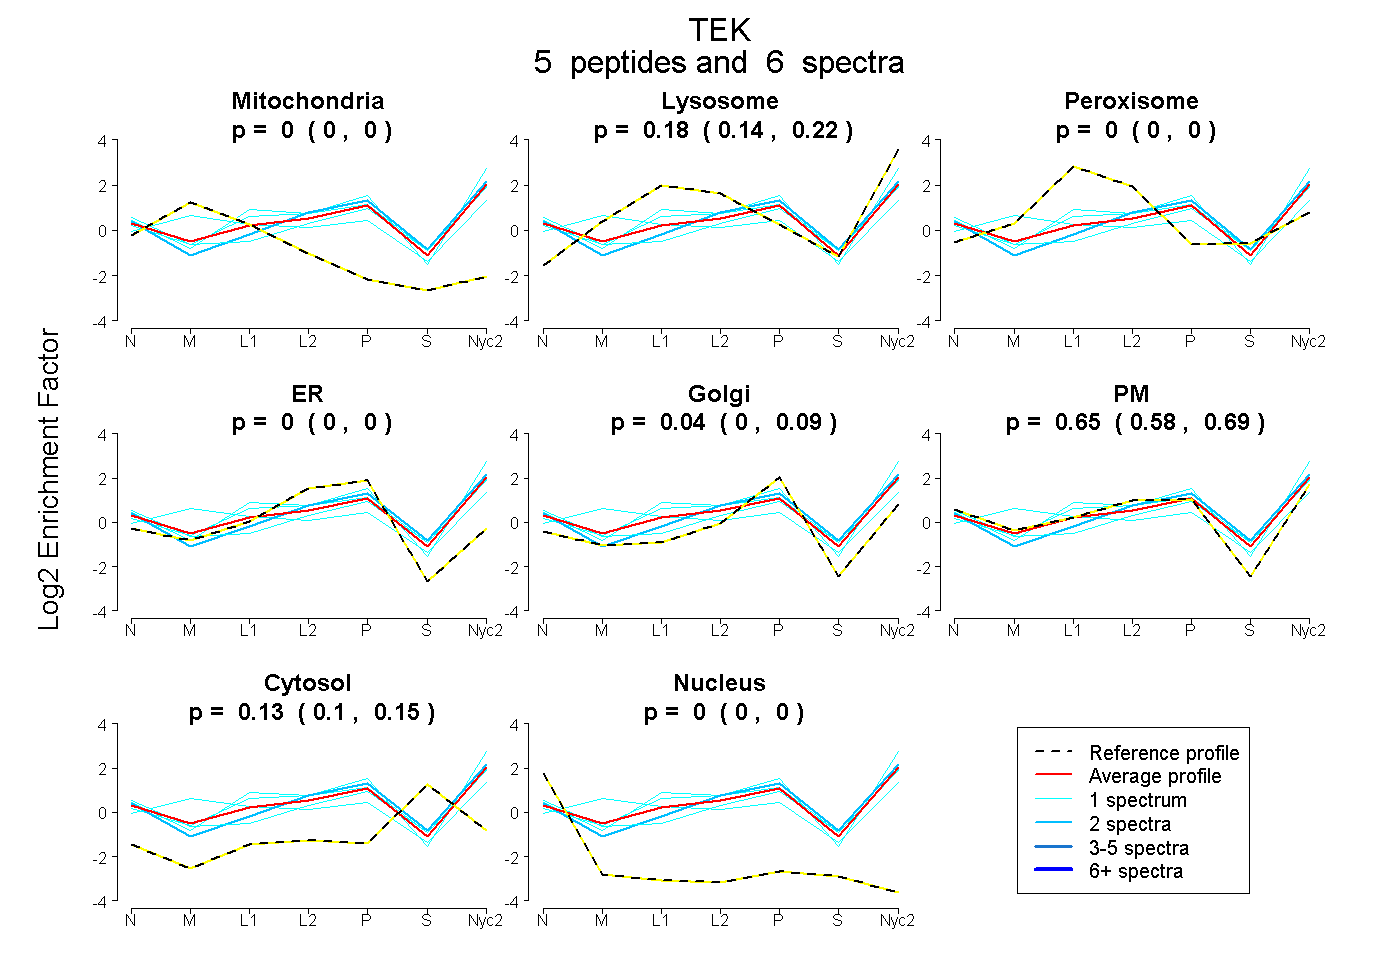
| Expt A |
5 peptides |
6 spectra |
|
0.000 0.000 | 0.000 |
0.182 0.143 | 0.215 |
0.000 0.000 | 0.000 |
0.000 0.000 | 0.000 |
0.036 0.000 | 0.094 |
0.651 0.578 | 0.695 |
0.131 0.103 | 0.152 |
0.000 0.000 | 0.000 |
| 1 spectrum, AQGEWSEELR | 0.000 | 0.180 | 0.082 | 0.000 | 0.000 | 0.625 | 0.113 | 0.000 | ||
| 1 spectrum, DFEALMNQHQDPLEVTQDVTR | 0.202 | 0.264 | 0.000 | 0.000 | 0.111 | 0.364 | 0.059 | 0.000 | ||
| 2 spectra, IADFGLSR | 0.000 | 0.140 | 0.000 | 0.000 | 0.093 | 0.614 | 0.152 | 0.000 | ||
| 1 spectrum, NEDQHIDVK | 0.000 | 0.044 | 0.000 | 0.000 | 0.009 | 0.743 | 0.203 | 0.000 | ||
| 1 spectrum, GLSLLPK | 0.000 | 0.321 | 0.000 | 0.000 | 0.176 | 0.503 | 0.000 | 0.000 |
| Plot | Lyso | Other | |||||||||||
| Expt C |
5 peptides |
11 spectra |
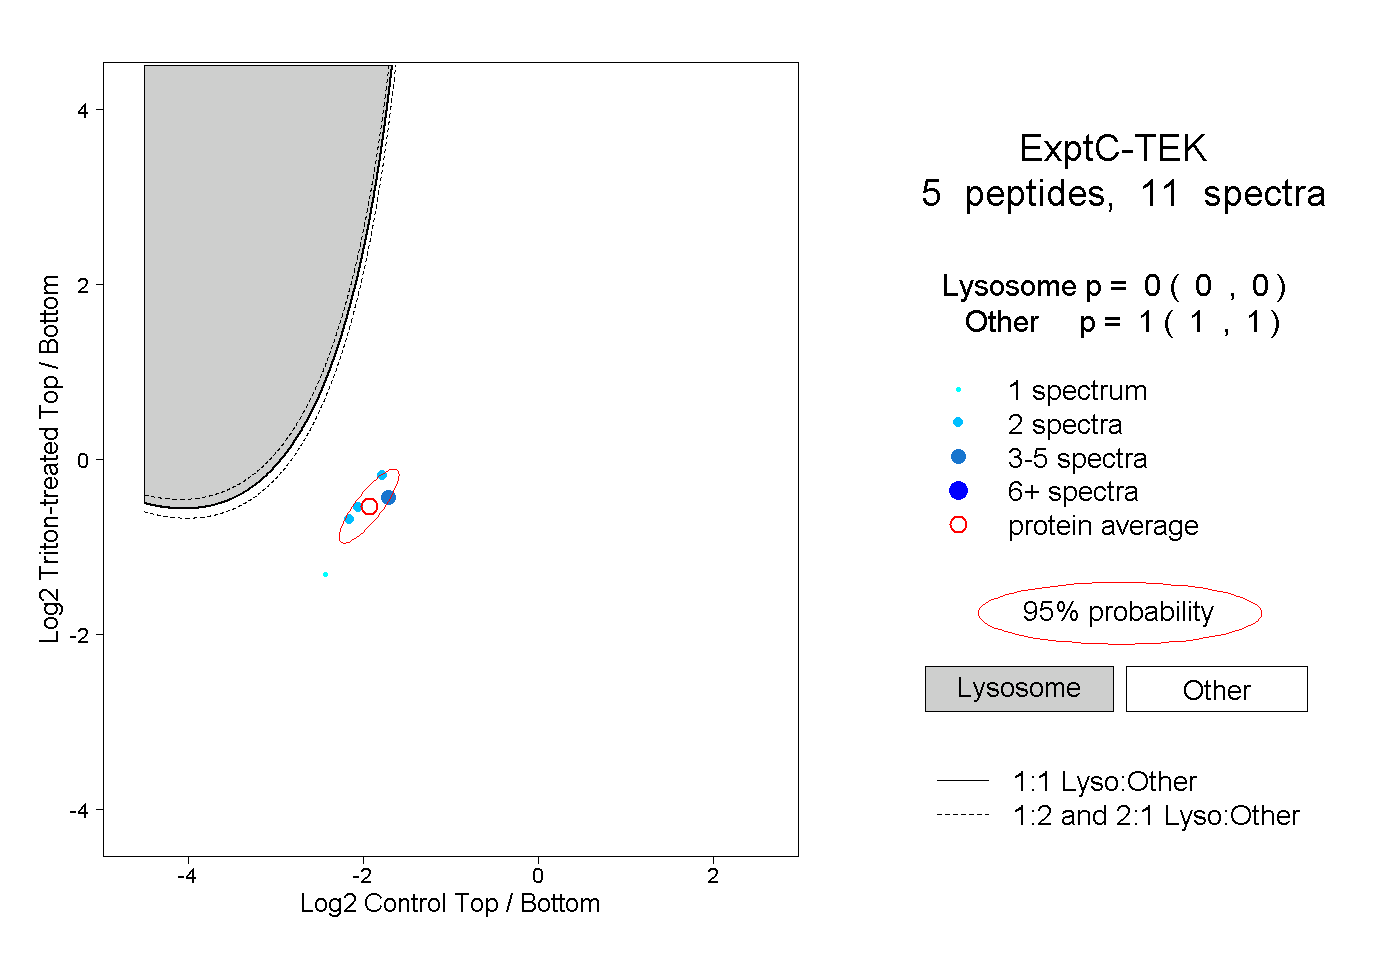 |
0.000 0.000 | 0.000 |
1.000 1.000 | 1.000 |
||||||||
| Plot | Lyso | Other | |||||||||||
| Expt D |
1 peptide |
1 spectrum |
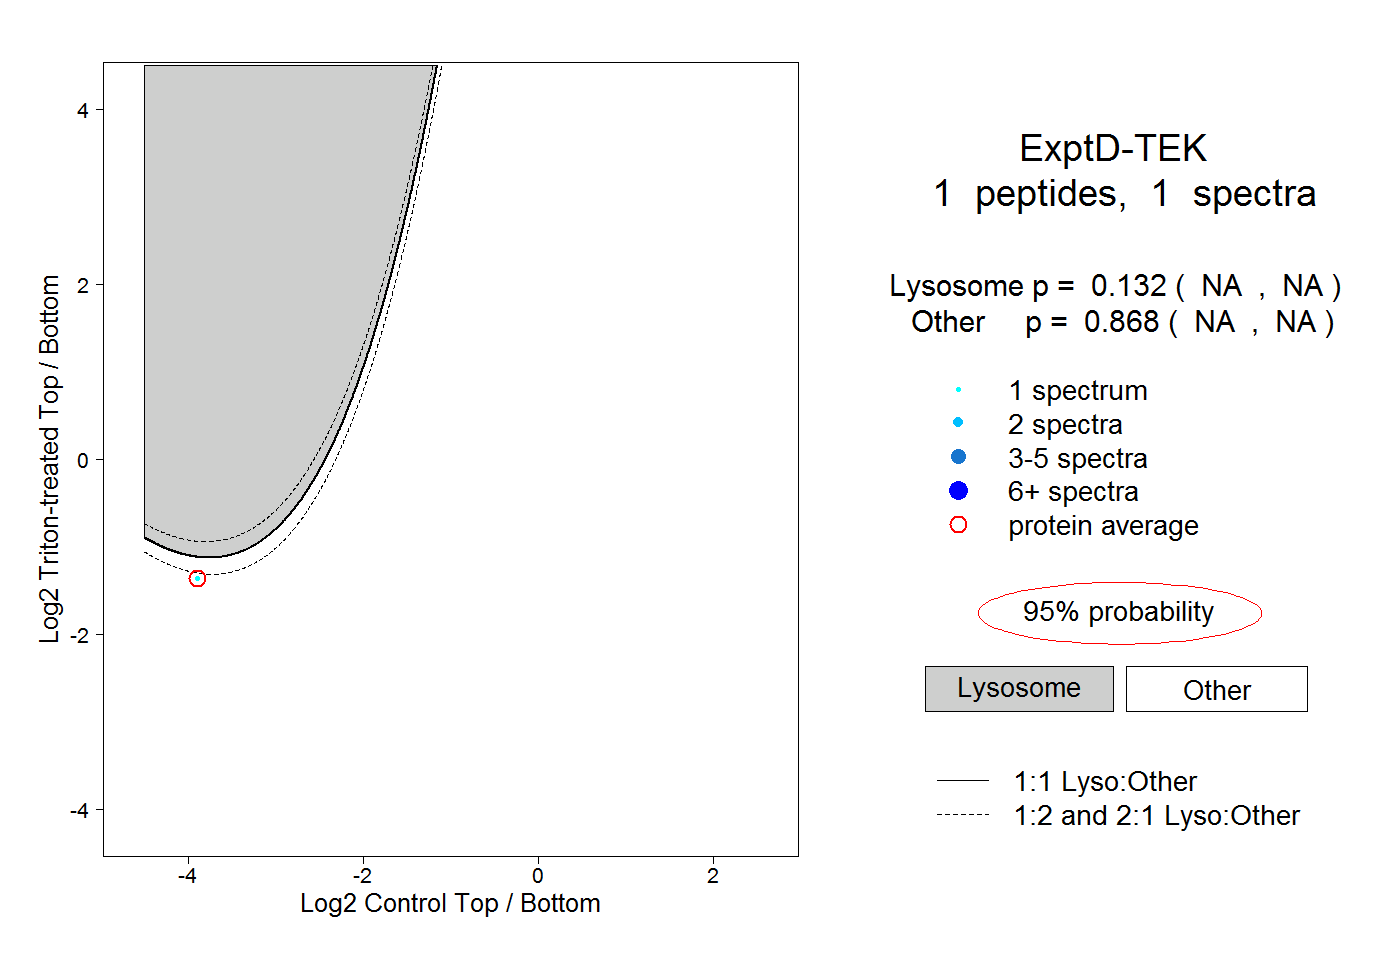 |
0.132 NA | NA |
0.868 NA | NA |