 4
4peptides
spectra
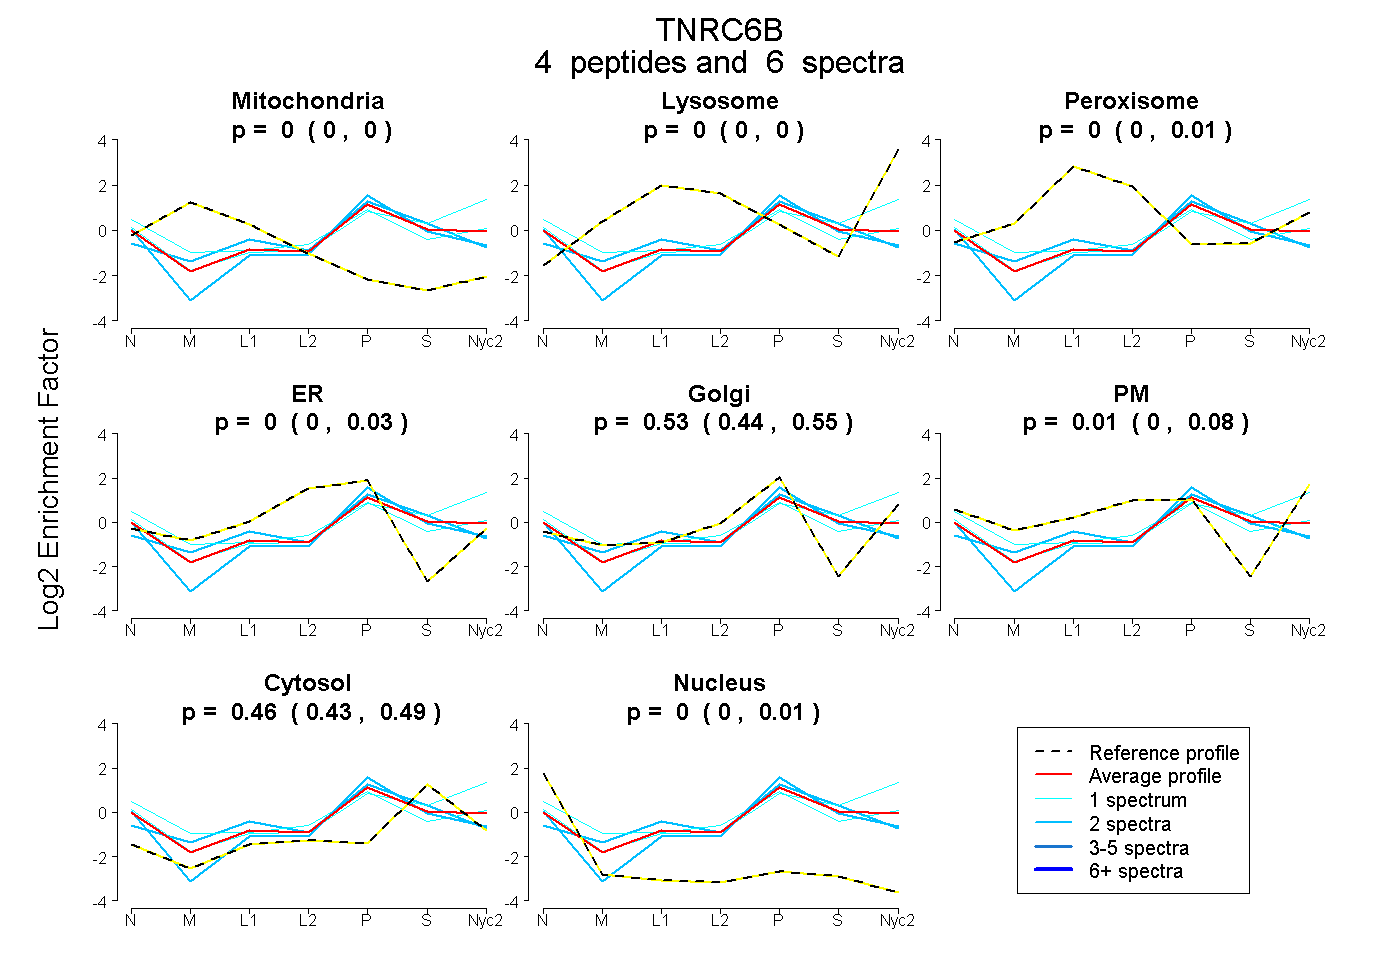
0.000 | 0.000
0.000 | 0.000
0.000 | 0.011
0.000 | 0.029
0.443 | 0.548
0.000 | 0.079
0.429 | 0.490
0.000 | 0.011
1peptide
spectrum
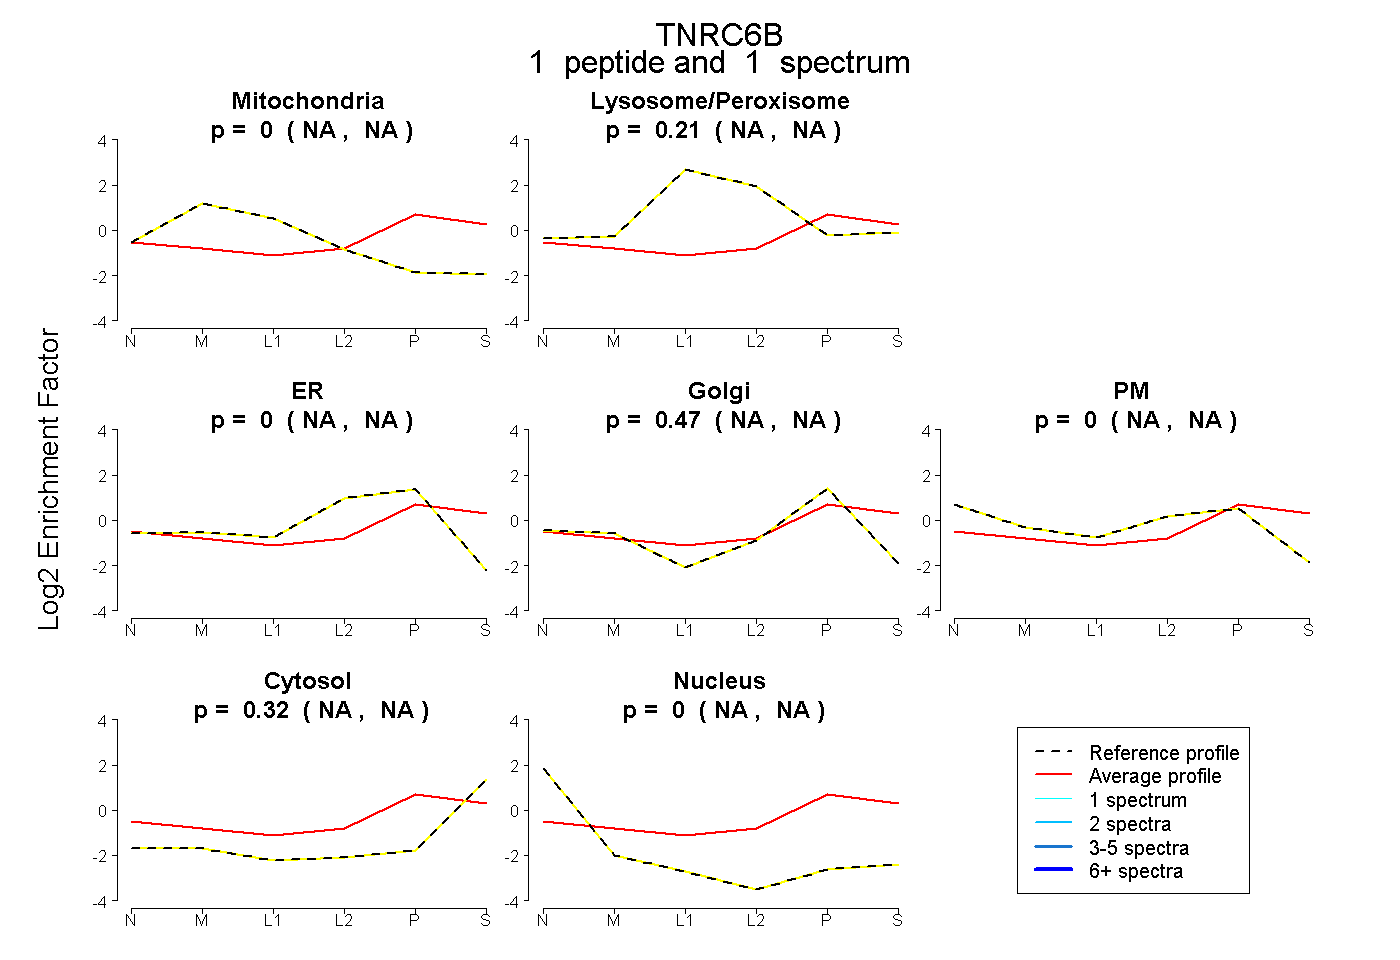
NA | NA
NA | NA
NA | NA
NA | NA
NA | NA
NA | NA
NA | NA
1peptide
spectrum
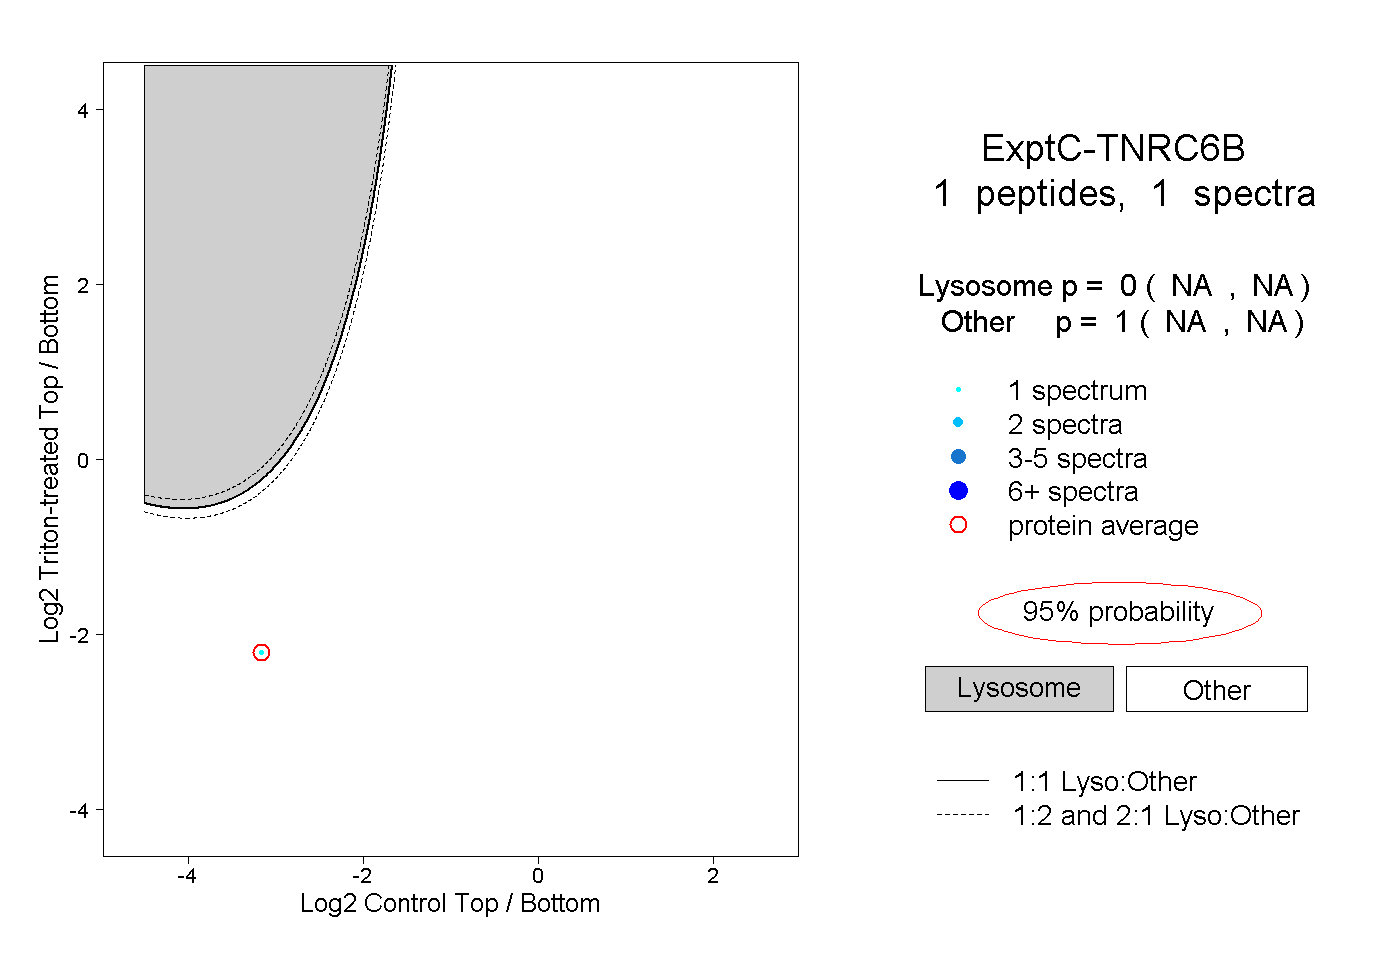
NA | NA
NA | NA
1peptide
spectrum
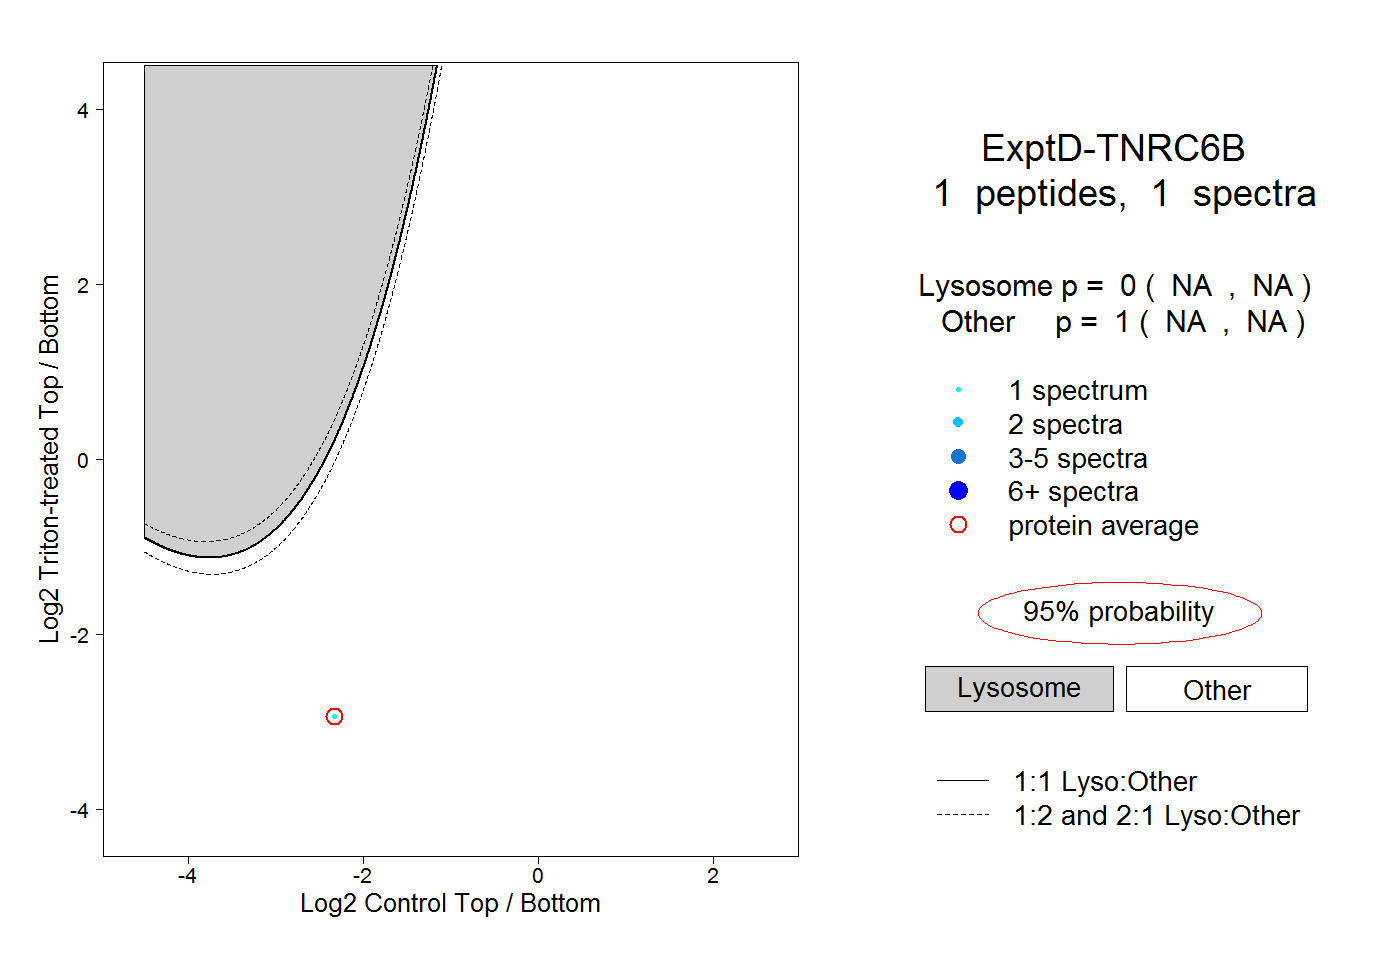
NA | NA
NA | NA