 4
4peptides
spectra
0.000 | 0.000
0.000 | 0.000
0.000 | 0.011
0.000 | 0.029
0.443 | 0.548
0.000 | 0.079
0.429 | 0.490
0.000 | 0.011
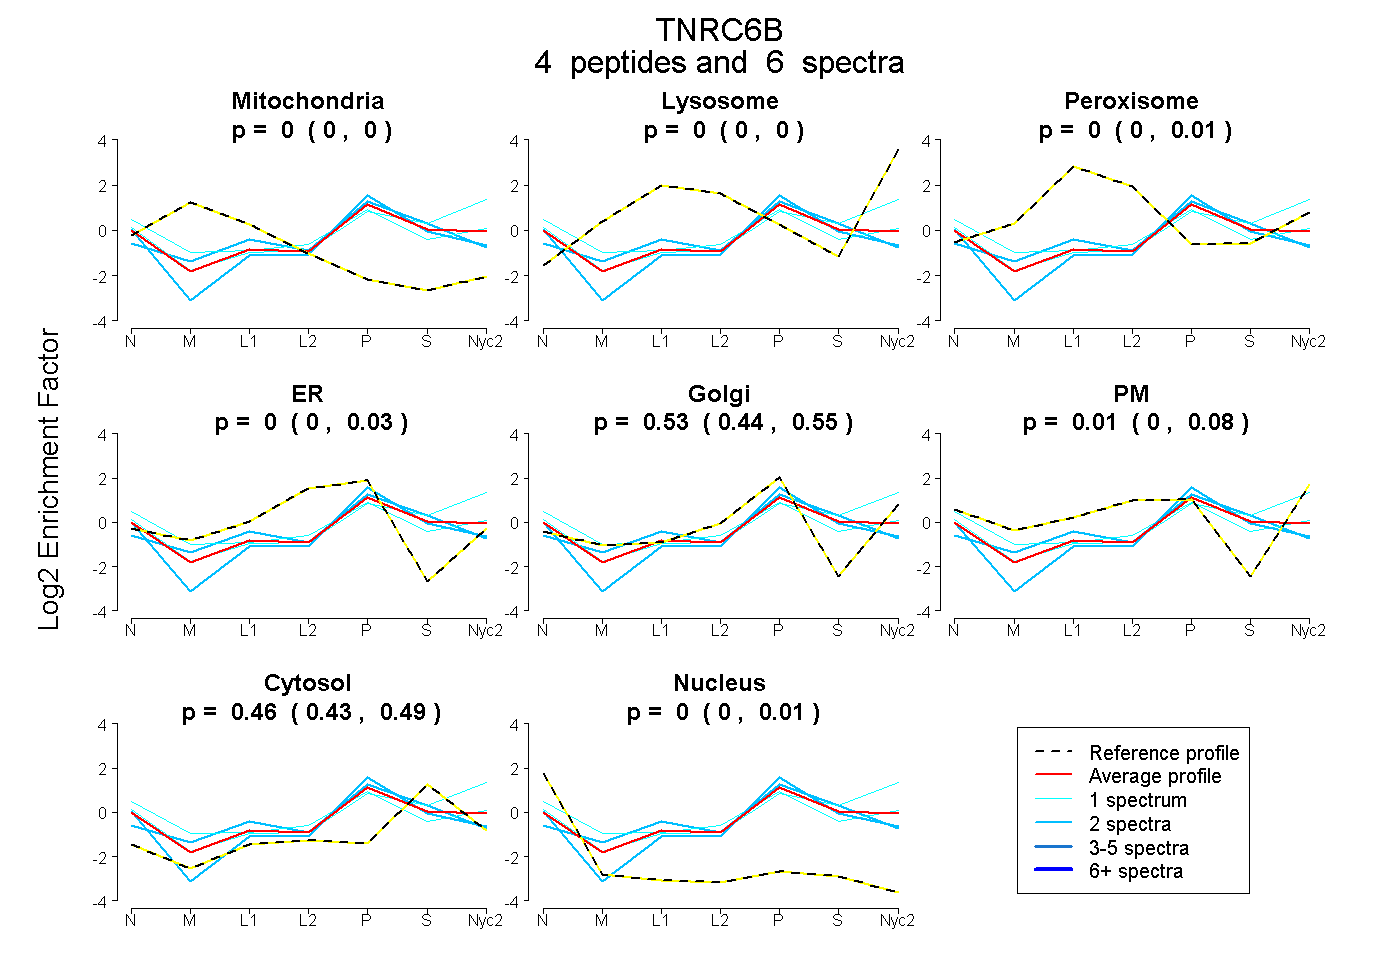
| Plot | Mito | Lyso | Perox | ER | Golgi | PM | Cytosol | Nucleus | |||||
| Expt A |
4 peptides |
6 spectra |
|
0.000 0.000 | 0.000 |
0.000 0.000 | 0.000 |
0.000 0.000 | 0.011 |
0.000 0.000 | 0.029 |
0.528 0.443 | 0.548 |
0.009 0.000 | 0.079 |
0.463 0.429 | 0.490 |
0.000 0.000 | 0.011 |
| 1 spectrum, NGWGEEVDQVK | 0.000 | 0.000 | 0.000 | 0.000 | 0.307 | 0.299 | 0.351 | 0.043 | ||
| 2 spectra, QQQEQQLAR | 0.000 | 0.000 | 0.000 | 0.000 | 0.483 | 0.000 | 0.466 | 0.051 | ||
| 1 spectrum, GHPLPENQGNAQAPCWGR | 0.000 | 0.034 | 0.000 | 0.000 | 0.258 | 0.245 | 0.463 | 0.000 | ||
| 2 spectra, DLGTTDSGPYFEK | 0.000 | 0.000 | 0.031 | 0.151 | 0.315 | 0.000 | 0.504 | 0.000 |
| Plot | Mito | Lyso or Perox | ER | Golgi | PM | Cytosol | Nucleus | ||||||
| Expt B |
1 peptide |
1 spectrum |
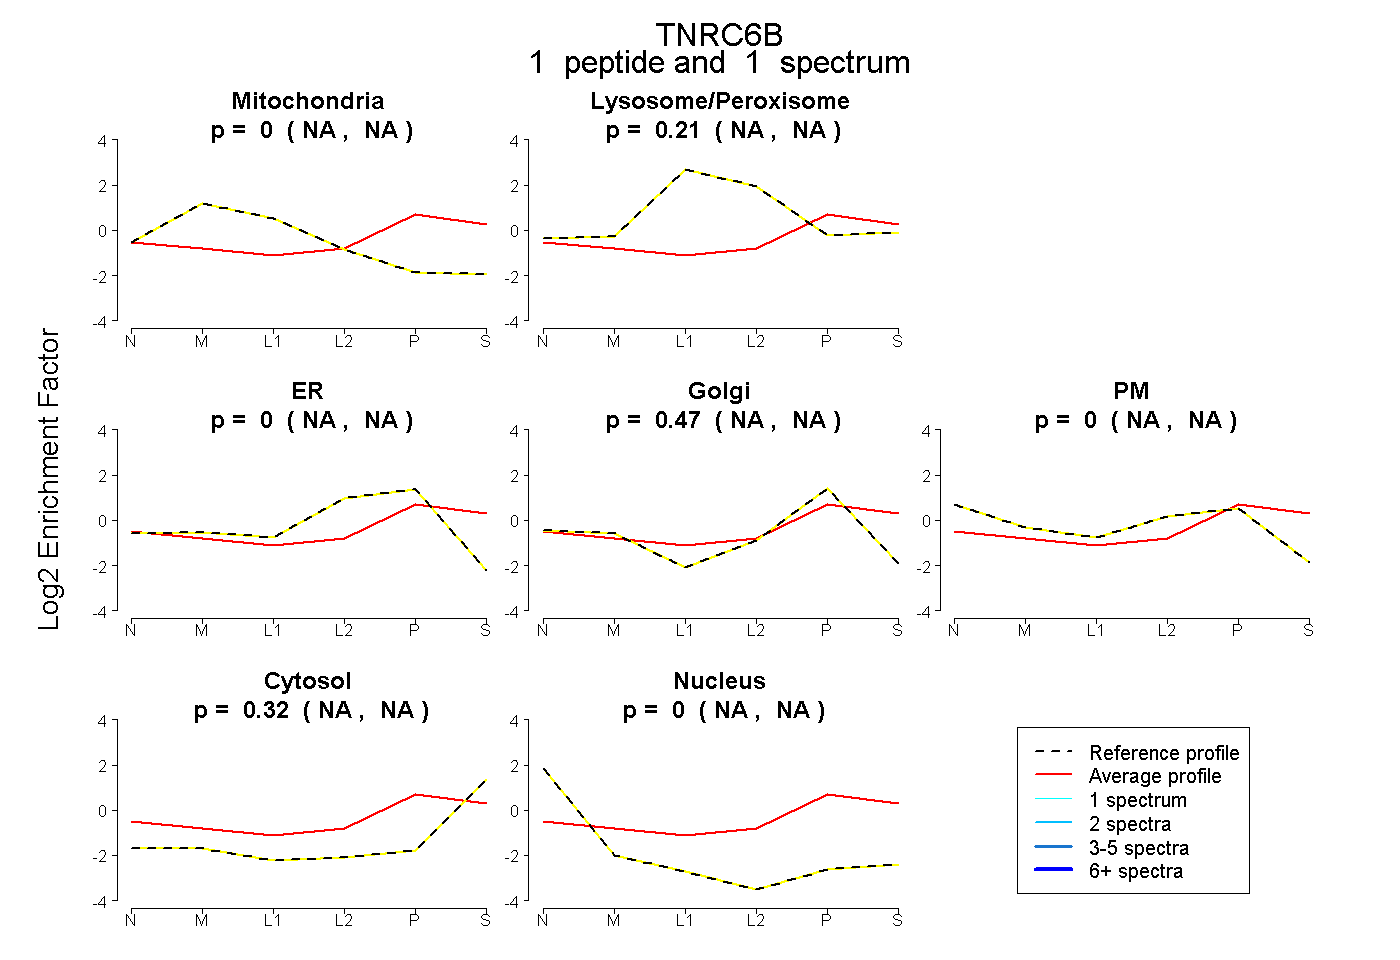 |
0.000 NA | NA |
0.212 NA | NA |
0.000 NA | NA |
0.465 NA | NA |
0.000 NA | NA |
0.323 NA | NA |
0.000 NA | NA |
|||
| Plot | Lyso | Other | |||||||||||
| Expt C |
1 peptide |
1 spectrum |
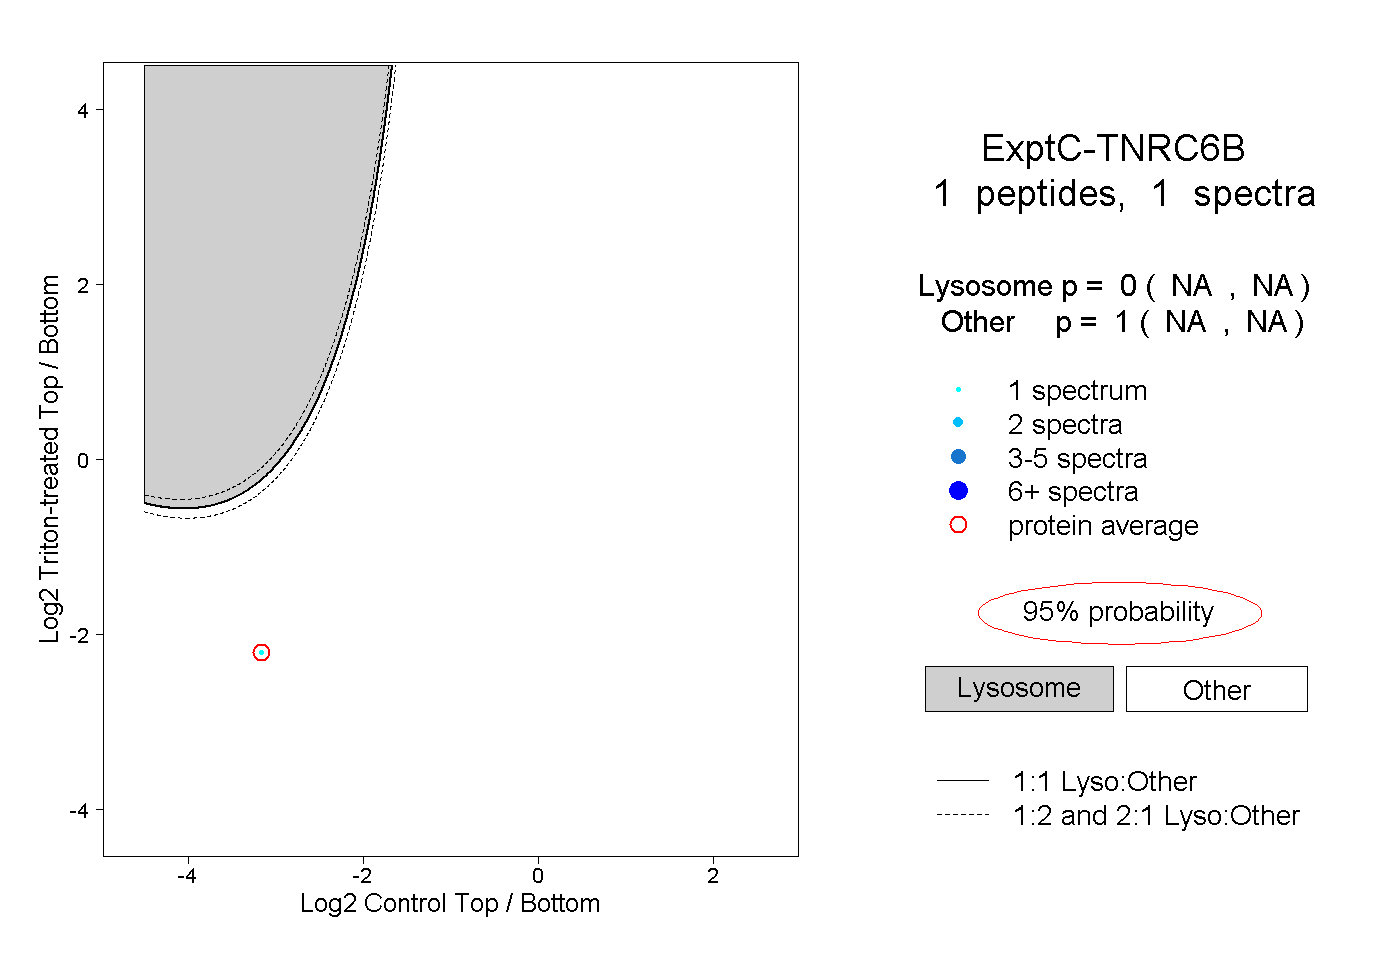 |
0.000 NA | NA |
1.000 NA | NA |
||||||||
| Plot | Lyso | Other | |||||||||||
| Expt D |
1 peptide |
1 spectrum |
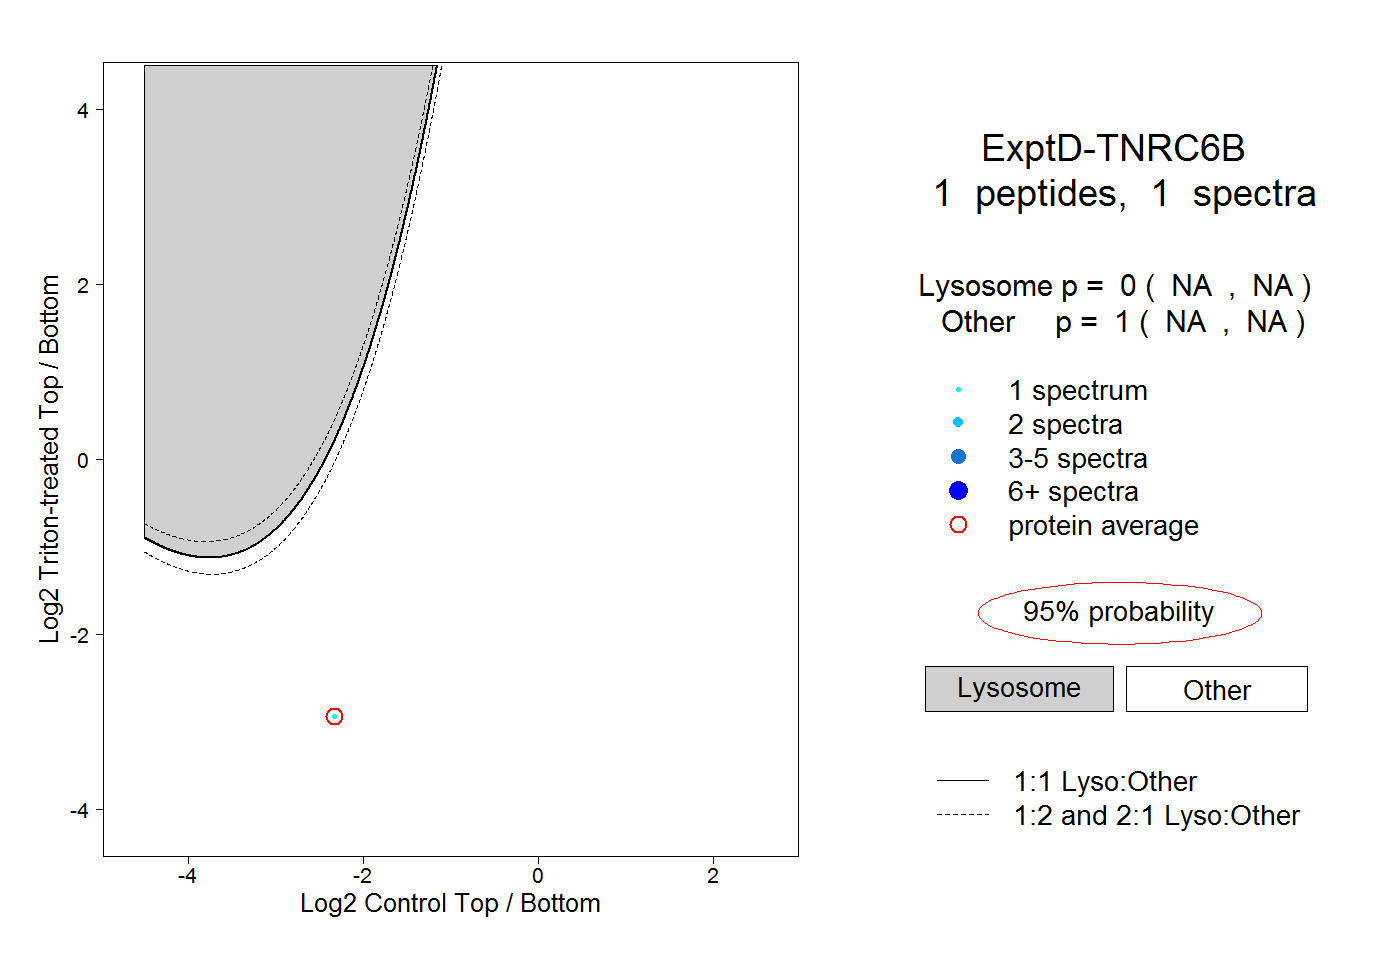 |
0.000 NA | NA |
1.000 NA | NA |