 5
5peptides
spectra
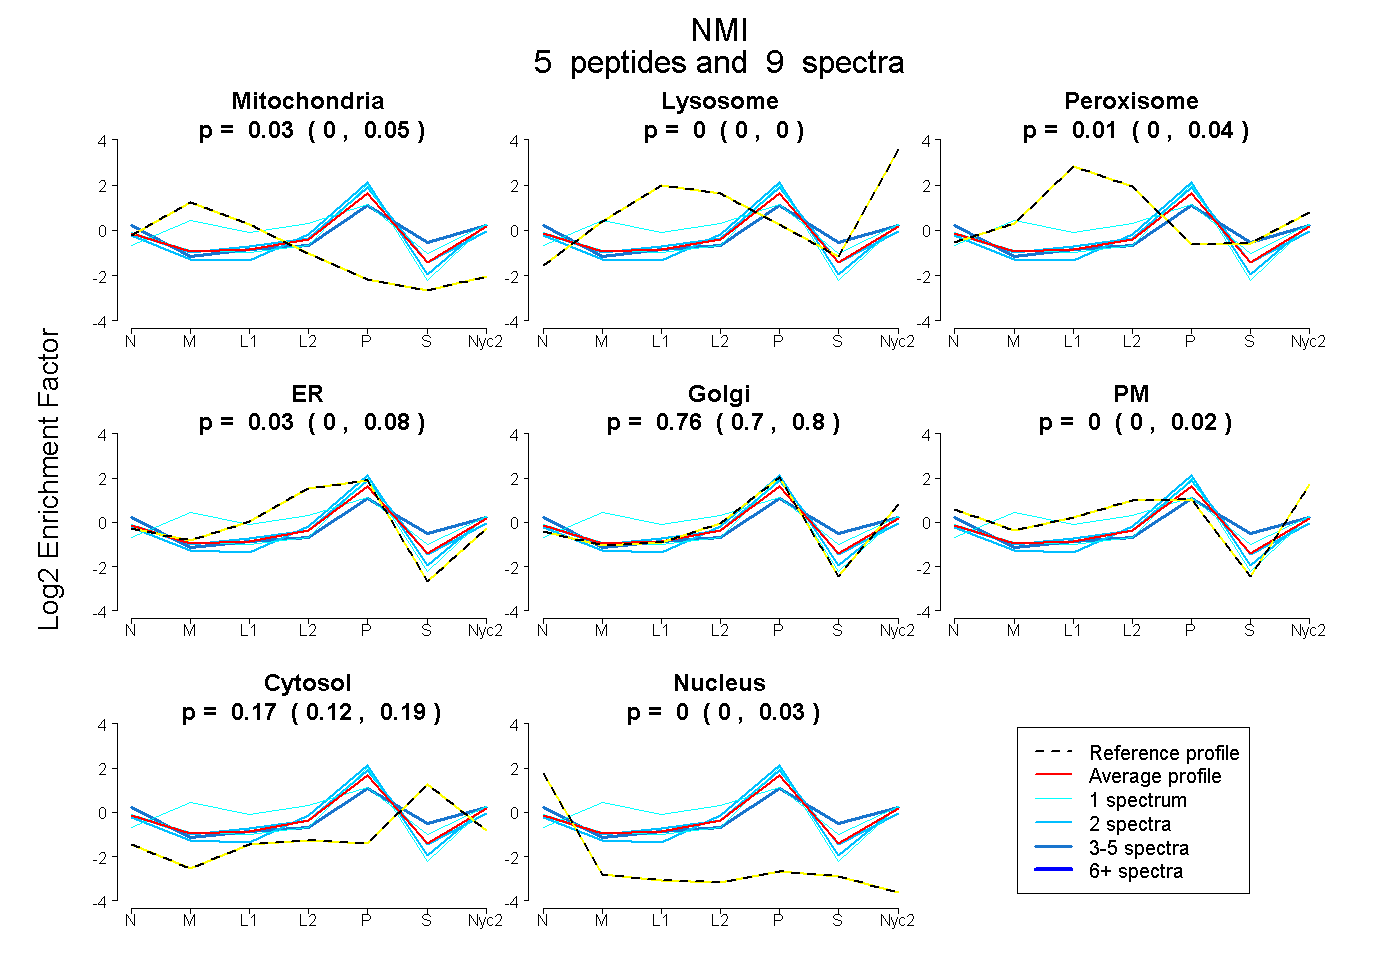
0.000 | 0.055
0.000 | 0.000
0.000 | 0.038
0.000 | 0.080
0.699 | 0.803
0.000 | 0.016
0.124 | 0.193
0.000 | 0.031
1peptide
spectra
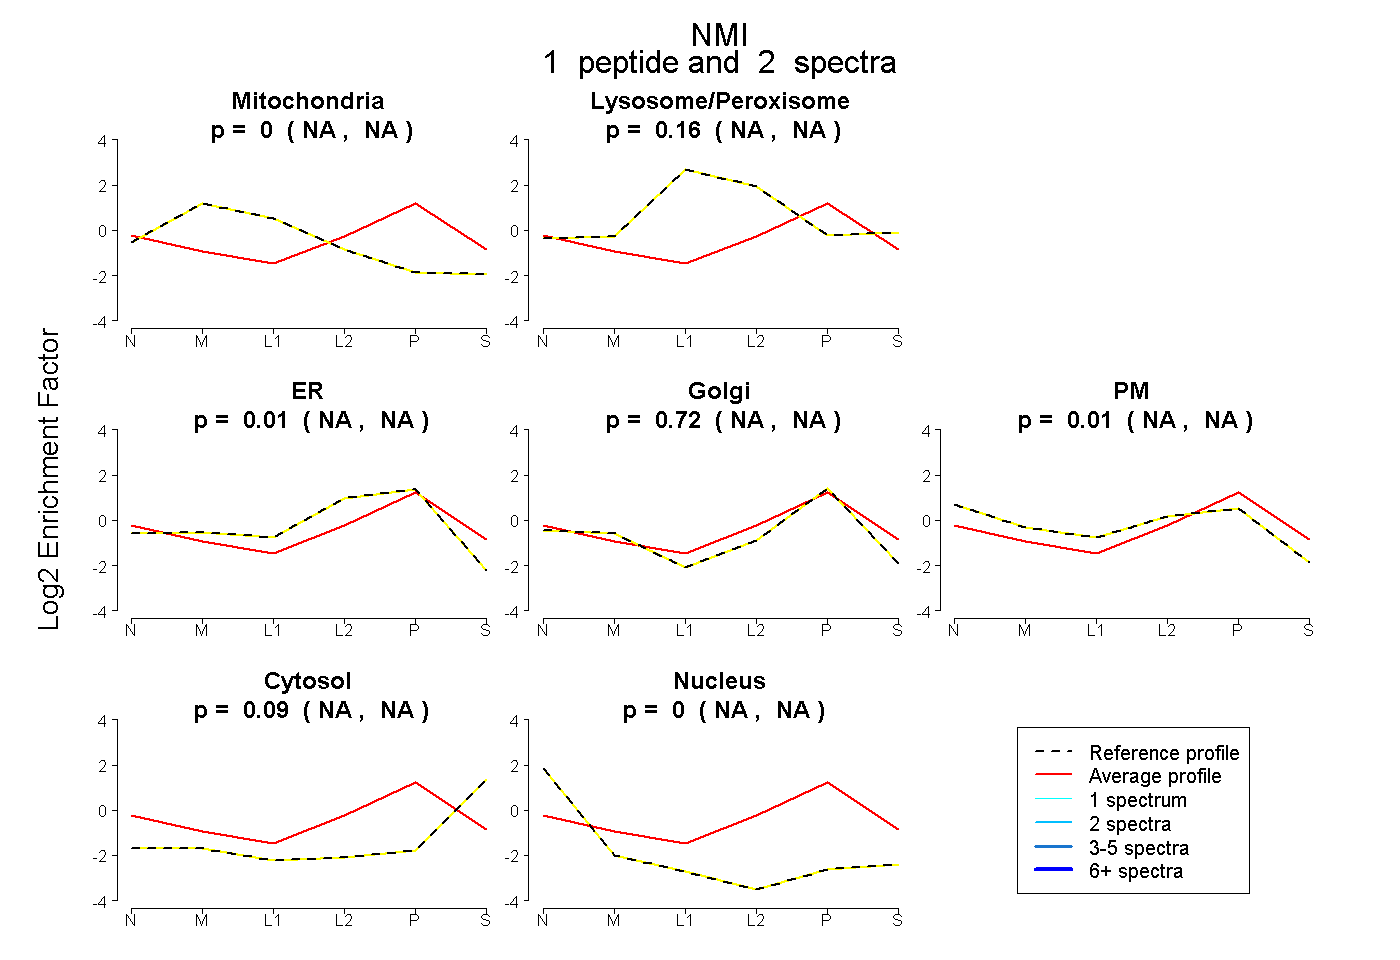
NA | NA
NA | NA
NA | NA
NA | NA
NA | NA
NA | NA
NA | NA
3peptides
spectra
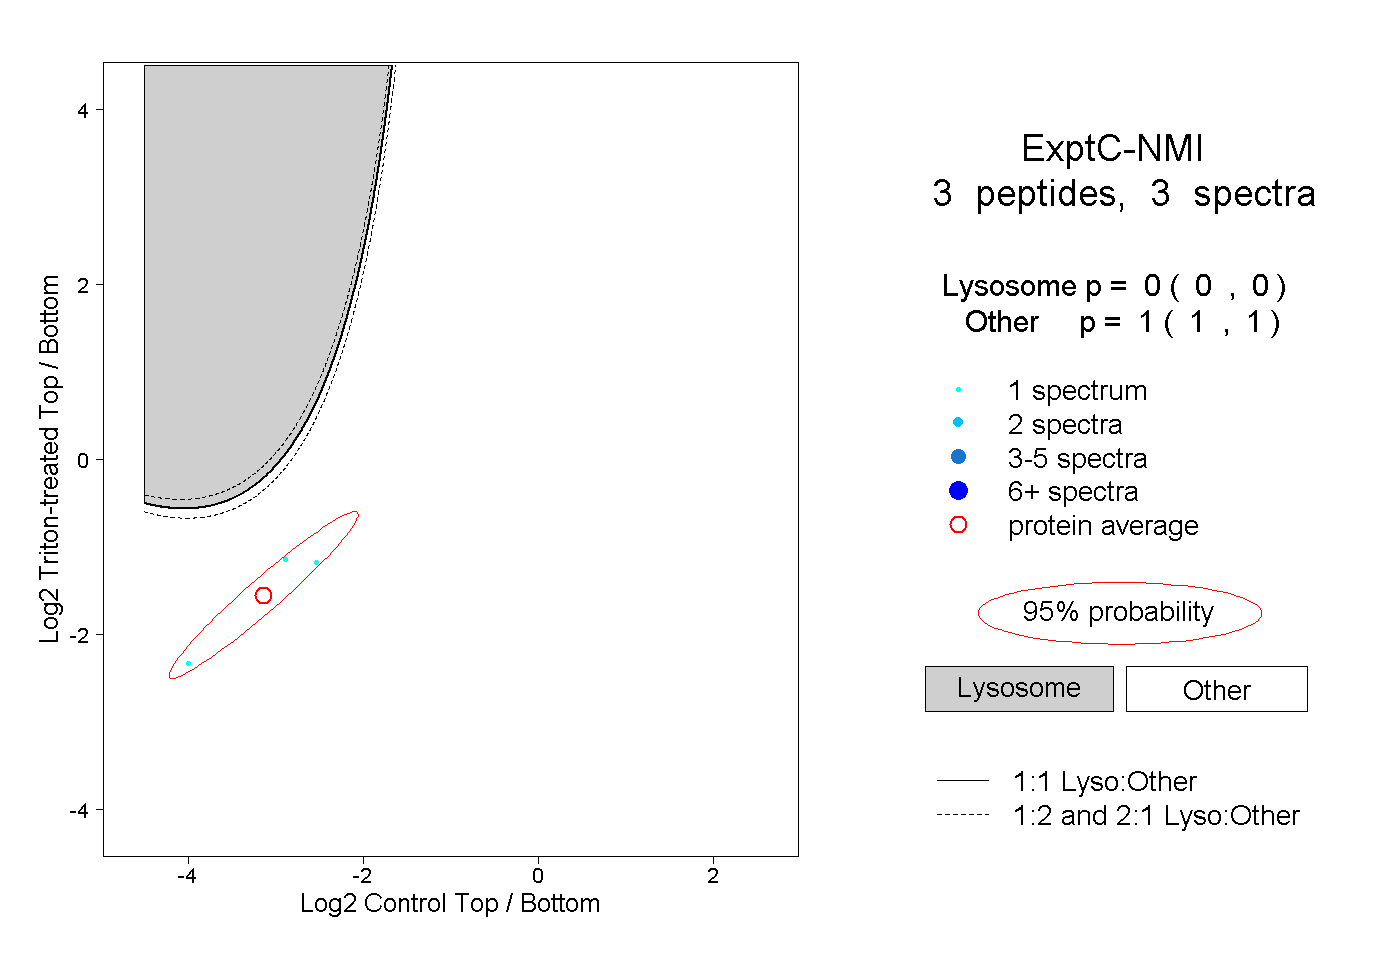
0.000 | 0.000
1.000 | 1.000