 5
5peptides
spectra
0.000 | 0.055
0.000 | 0.000
0.000 | 0.038
0.000 | 0.080
0.699 | 0.803
0.000 | 0.016
0.124 | 0.193
0.000 | 0.031
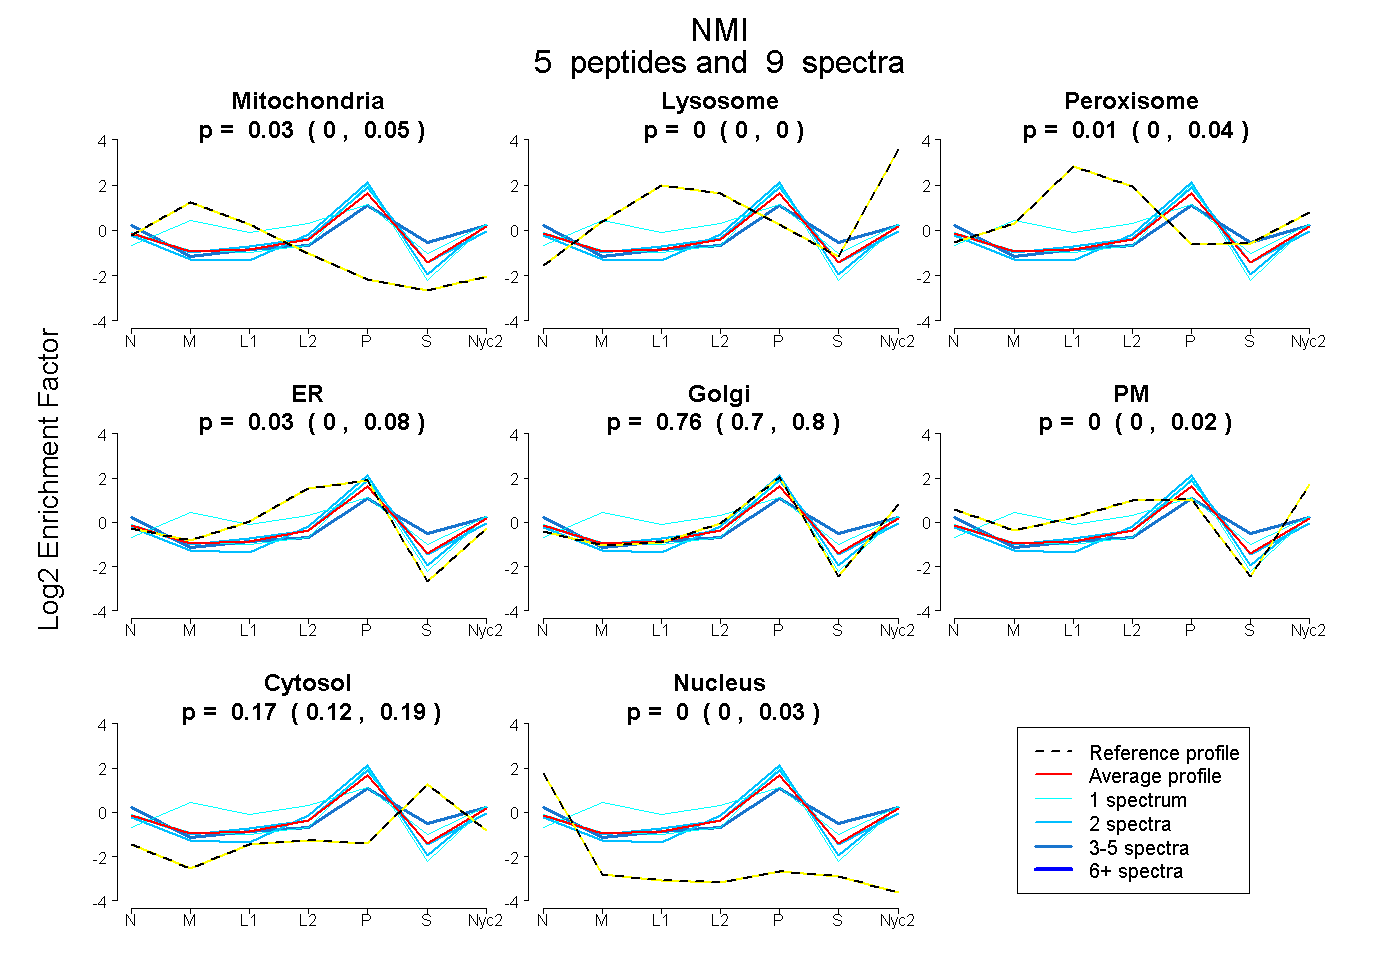
| Plot | Mito | Lyso | Perox | ER | Golgi | PM | Cytosol | Nucleus | |||||
| Expt A |
5 peptides |
9 spectra |
|
0.029 0.000 | 0.055 |
0.000 0.000 | 0.000 |
0.006 0.000 | 0.038 |
0.034 0.000 | 0.080 |
0.762 0.699 | 0.803 |
0.000 0.000 | 0.016 |
0.166 0.124 | 0.193 |
0.003 0.000 | 0.031 |
| 2 spectra, ENVPER | 0.003 | 0.000 | 0.000 | 0.138 | 0.688 | 0.000 | 0.157 | 0.013 | ||
| 3 spectra, FQVHVDISK | 0.000 | 0.000 | 0.000 | 0.000 | 0.440 | 0.197 | 0.348 | 0.014 | ||
| 1 spectrum, WYNVTVSPFIER | 0.008 | 0.000 | 0.000 | 0.000 | 0.918 | 0.000 | 0.000 | 0.074 | ||
| 1 spectrum, VSAHPVPLSTGVR | 0.113 | 0.040 | 0.243 | 0.000 | 0.538 | 0.000 | 0.066 | 0.000 | ||
| 2 spectra, NGGGEVESVDYDR | 0.000 | 0.000 | 0.000 | 0.000 | 0.904 | 0.000 | 0.059 | 0.038 |
| Plot | Mito | Lyso or Perox | ER | Golgi | PM | Cytosol | Nucleus | ||||||
| Expt B |
1 peptide |
2 spectra |
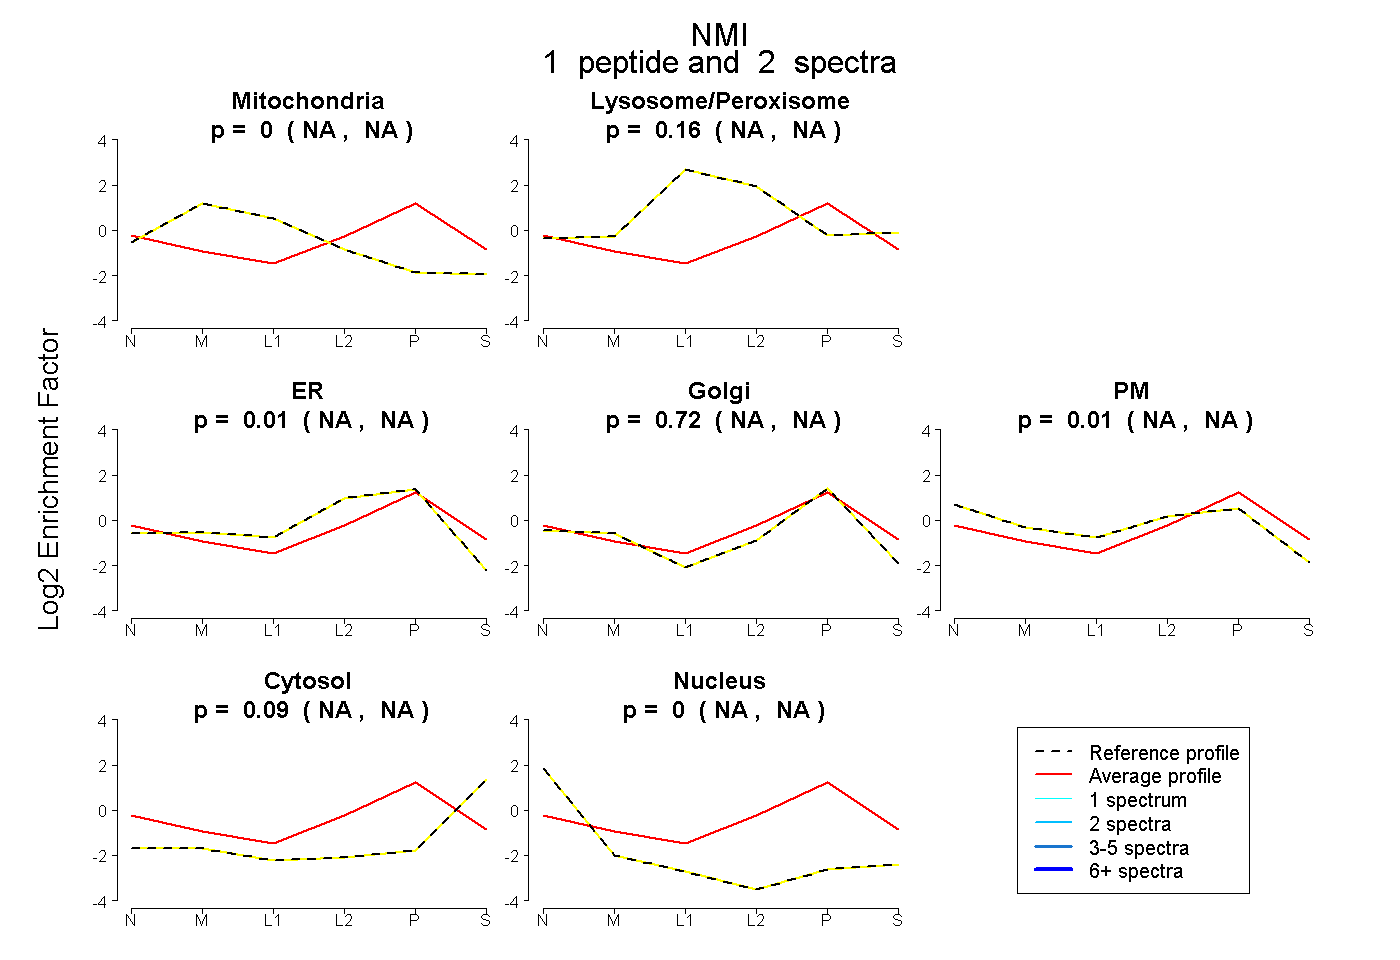 |
0.000 NA | NA |
0.165 NA | NA |
0.011 NA | NA |
0.719 NA | NA |
0.011 NA | NA |
0.094 NA | NA |
0.000 NA | NA |
|||
| Plot | Lyso | Other | |||||||||||
| Expt C |
3 peptides |
3 spectra |
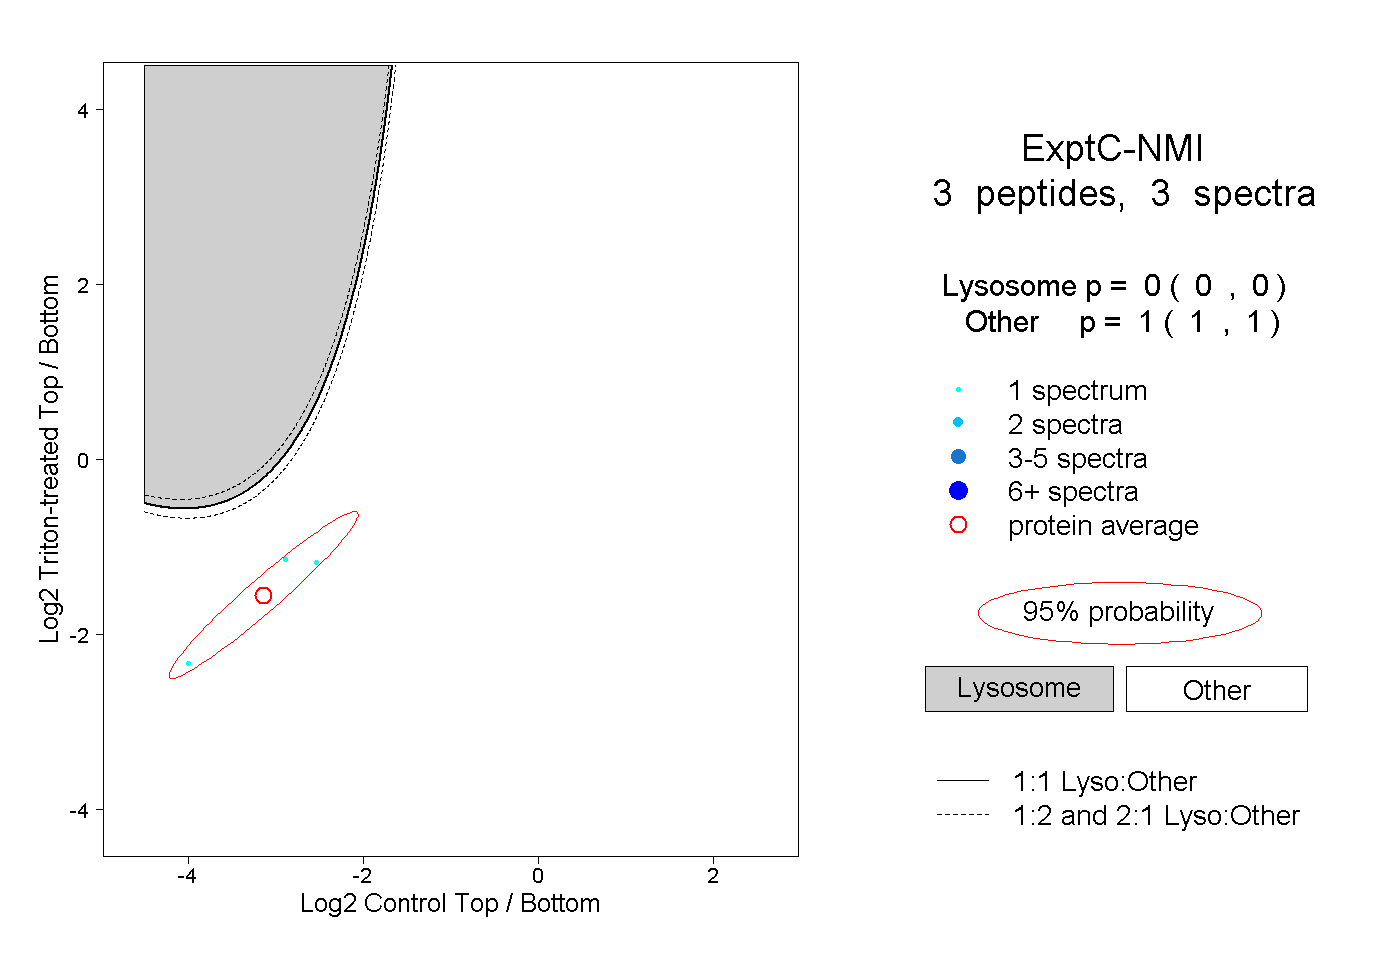 |
0.000 0.000 | 0.000 |
1.000 1.000 | 1.000 |