 10
10peptides
spectra
0.000 | 0.000
0.000 | 0.000
0.000 | 0.000
0.000 | 0.073
0.185 | 0.279
0.000 | 0.000
0.140 | 0.165
0.559 | 0.585
3peptides
spectra
0.000 | 0.000
1.000 | 1.000
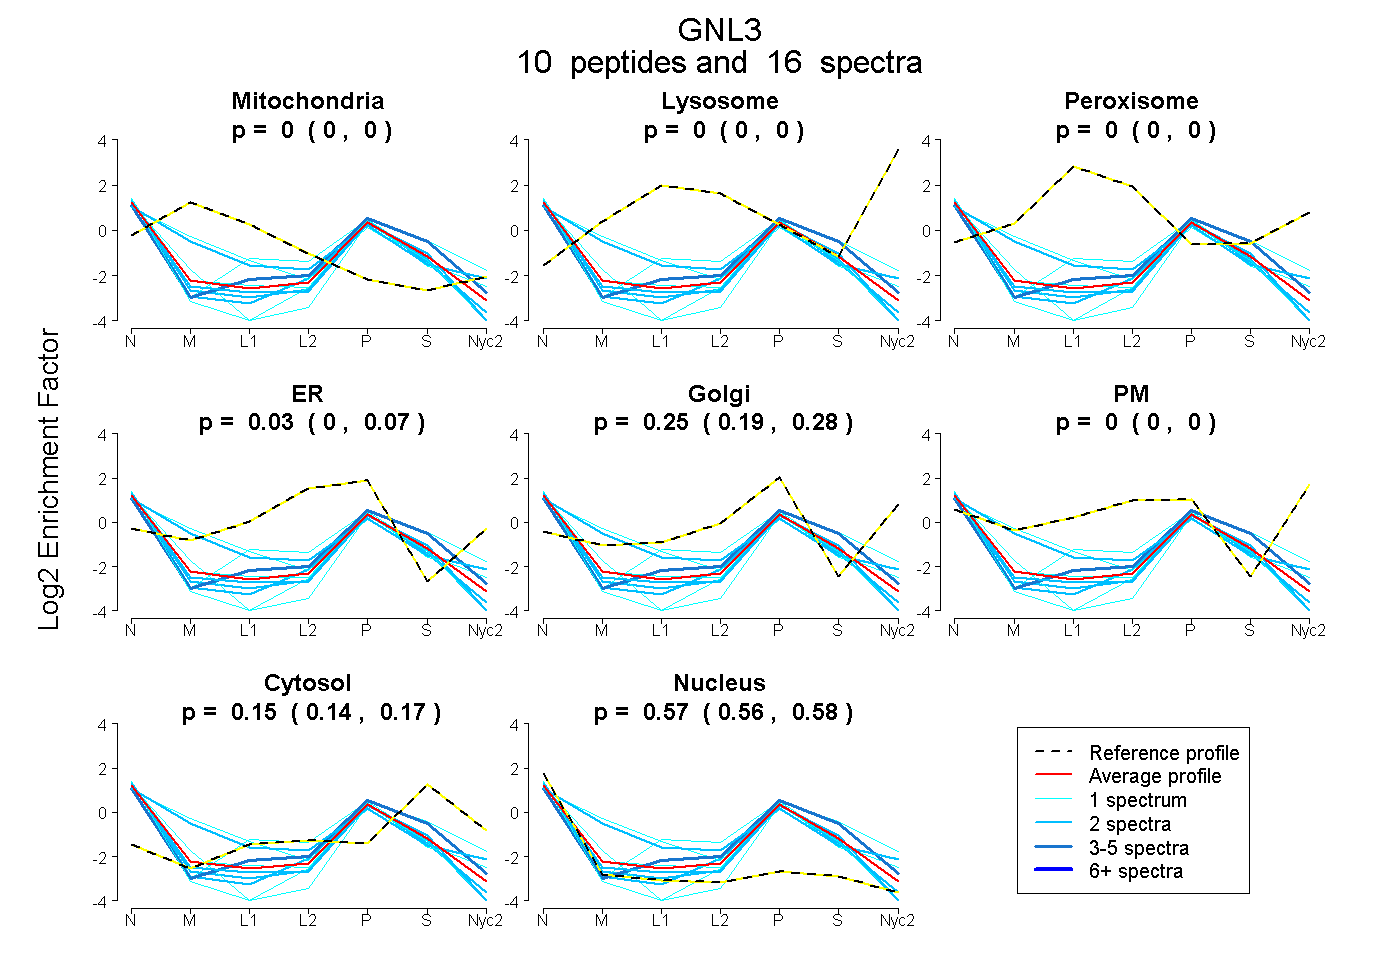
| Plot | Mito | Lyso | Perox | ER | Golgi | PM | Cytosol | Nucleus | |||||
| Expt A |
10 peptides |
16 spectra |
|
0.000 0.000 | 0.000 |
0.000 0.000 | 0.000 |
0.000 0.000 | 0.000 |
0.028 0.000 | 0.073 |
0.245 0.185 | 0.279 |
0.000 0.000 | 0.000 |
0.154 0.140 | 0.165 |
0.573 0.559 | 0.585 |
||
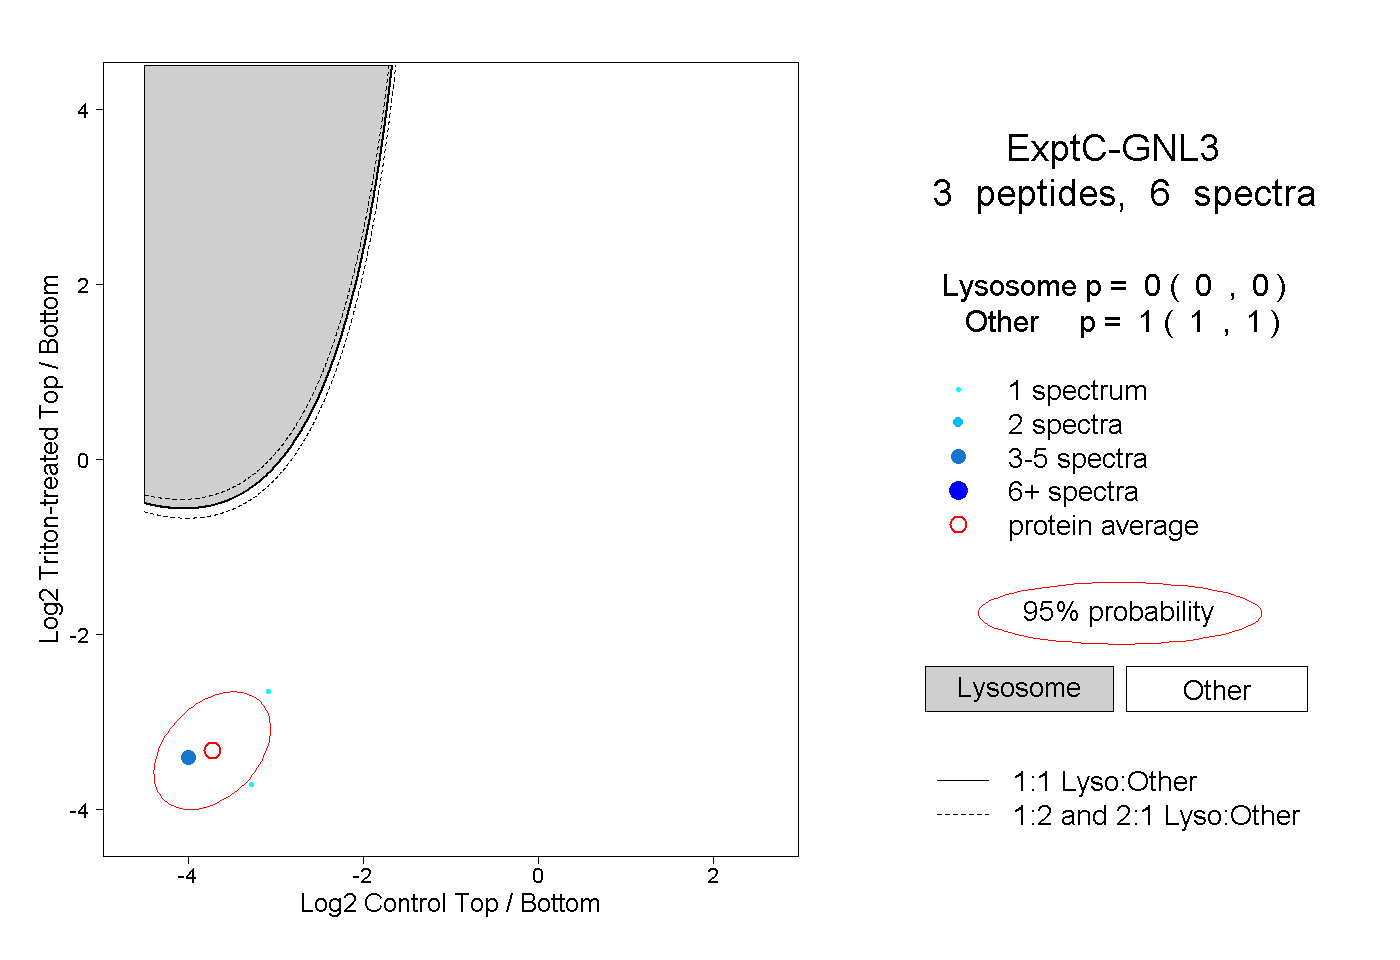
| Plot | Lyso | Other | |||||||||||
| Expt C |
3 peptides |
6 spectra |
|
0.000 0.000 | 0.000 |
1.000 1.000 | 1.000 |