 10
10peptides
spectra
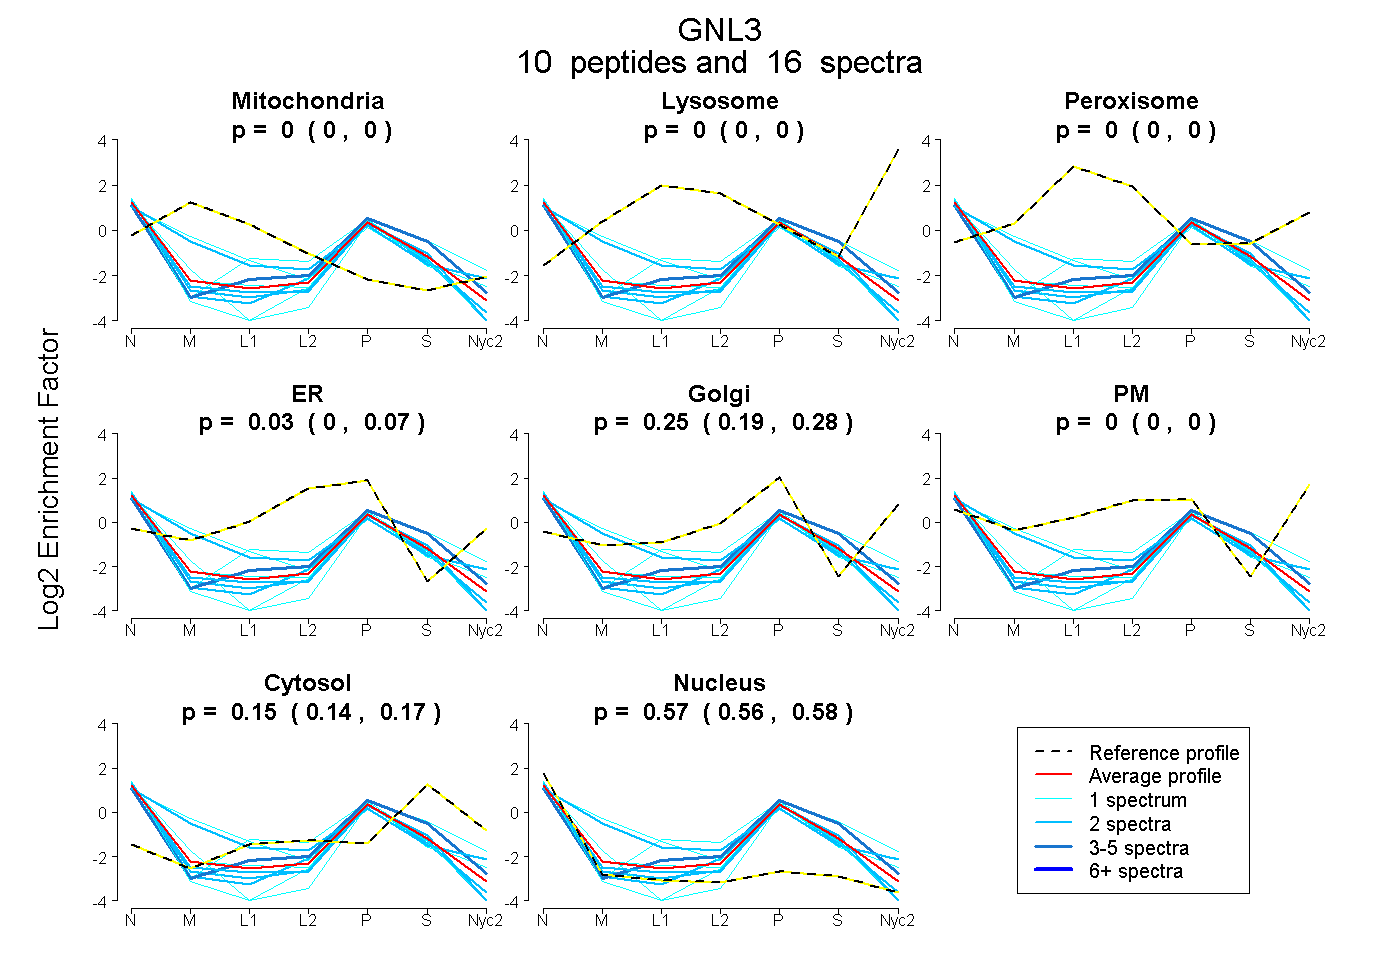
0.000 | 0.000
0.000 | 0.000
0.000 | 0.000
0.000 | 0.073
0.185 | 0.279
0.000 | 0.000
0.140 | 0.165
0.559 | 0.585
| Plot | Mito | Lyso | Perox | ER | Golgi | PM | Cytosol | Nucleus | |||||
| Expt A |
10 peptides |
16 spectra |
|
0.000 0.000 | 0.000 |
0.000 0.000 | 0.000 |
0.000 0.000 | 0.000 |
0.028 0.000 | 0.073 |
0.245 0.185 | 0.279 |
0.000 0.000 | 0.000 |
0.154 0.140 | 0.165 |
0.573 0.559 | 0.585 |
| 2 spectra, SSLINSLK | 0.210 | 0.000 | 0.000 | 0.024 | 0.355 | 0.000 | 0.061 | 0.350 | ||
| 1 spectrum, VIEASDIVLEVLDAR | 0.000 | 0.000 | 0.000 | 0.000 | 0.101 | 0.000 | 0.106 | 0.793 | ||
| 1 spectrum, DPLGCR | 0.000 | 0.000 | 0.000 | 0.198 | 0.130 | 0.000 | 0.366 | 0.306 | ||
| 3 spectra, LVLVLNK | 0.000 | 0.000 | 0.000 | 0.063 | 0.171 | 0.000 | 0.313 | 0.453 | ||
| 2 spectra, YTVPGYK | 0.000 | 0.000 | 0.000 | 0.082 | 0.079 | 0.000 | 0.171 | 0.667 | ||
| 1 spectrum, ICSVGVSMGLTR | 0.291 | 0.000 | 0.000 | 0.000 | 0.301 | 0.000 | 0.062 | 0.345 | ||
| 2 spectra, DSLDFFTK | 0.000 | 0.000 | 0.000 | 0.000 | 0.229 | 0.000 | 0.097 | 0.675 | ||
| 2 spectra, GFNLEELEK | 0.000 | 0.000 | 0.000 | 0.160 | 0.019 | 0.000 | 0.134 | 0.687 | ||
| 1 spectrum, ELPTVVFK | 0.000 | 0.000 | 0.000 | 0.000 | 0.218 | 0.000 | 0.079 | 0.703 | ||
| 1 spectrum, LLGGFQQSCGK | 0.000 | 0.000 | 0.000 | 0.000 | 0.382 | 0.000 | 0.076 | 0.542 |
| Plot | Lyso | Other | |||||||||||
| Expt C |
3 peptides |
6 spectra |
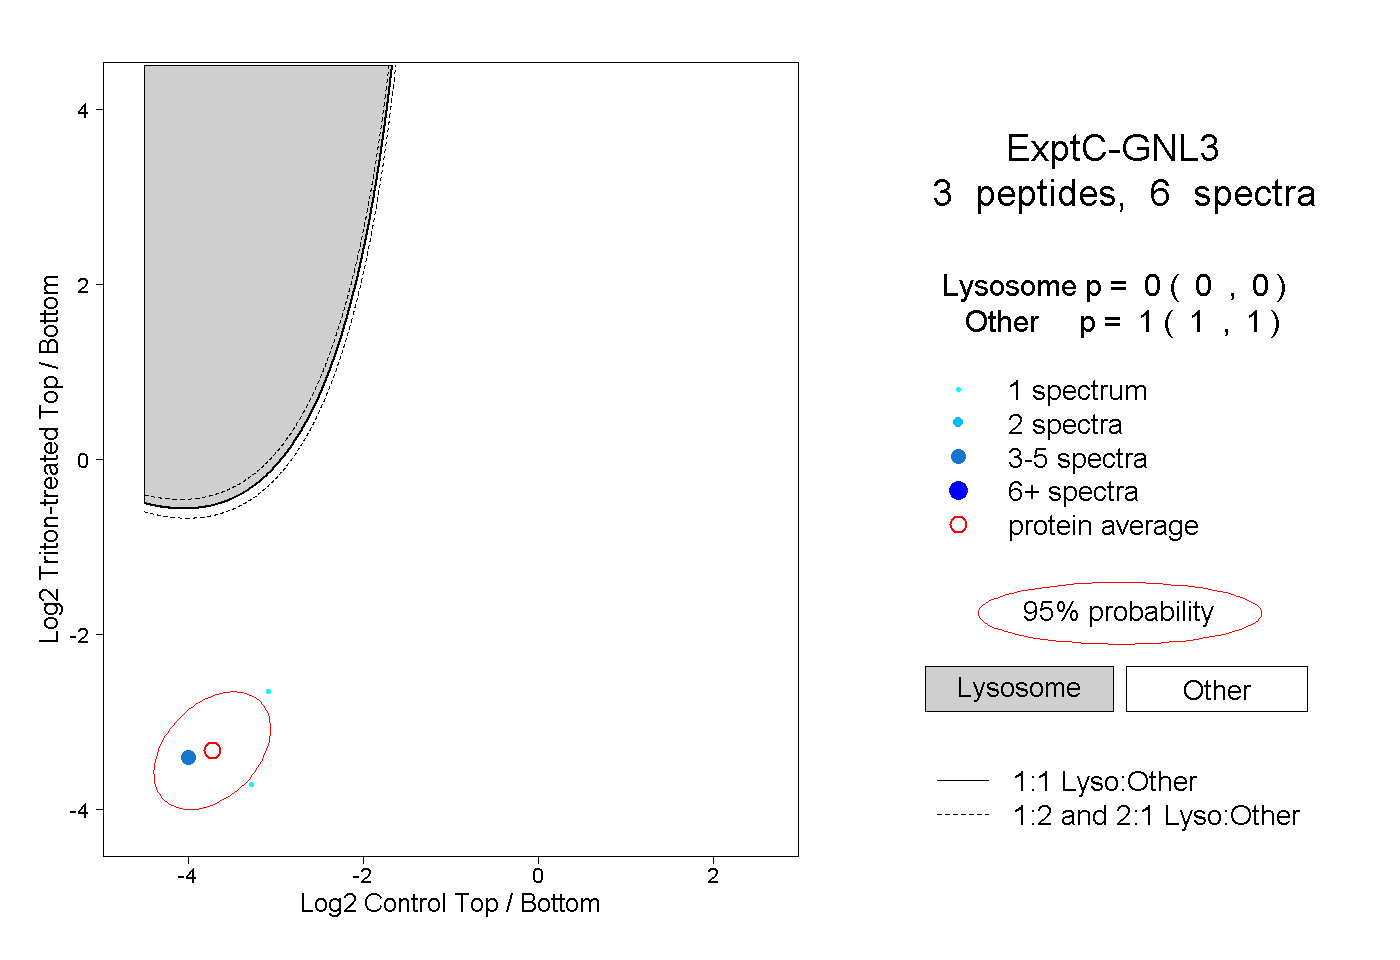 |
0.000 0.000 | 0.000 |
1.000 1.000 | 1.000 |