 5
5peptides
spectra
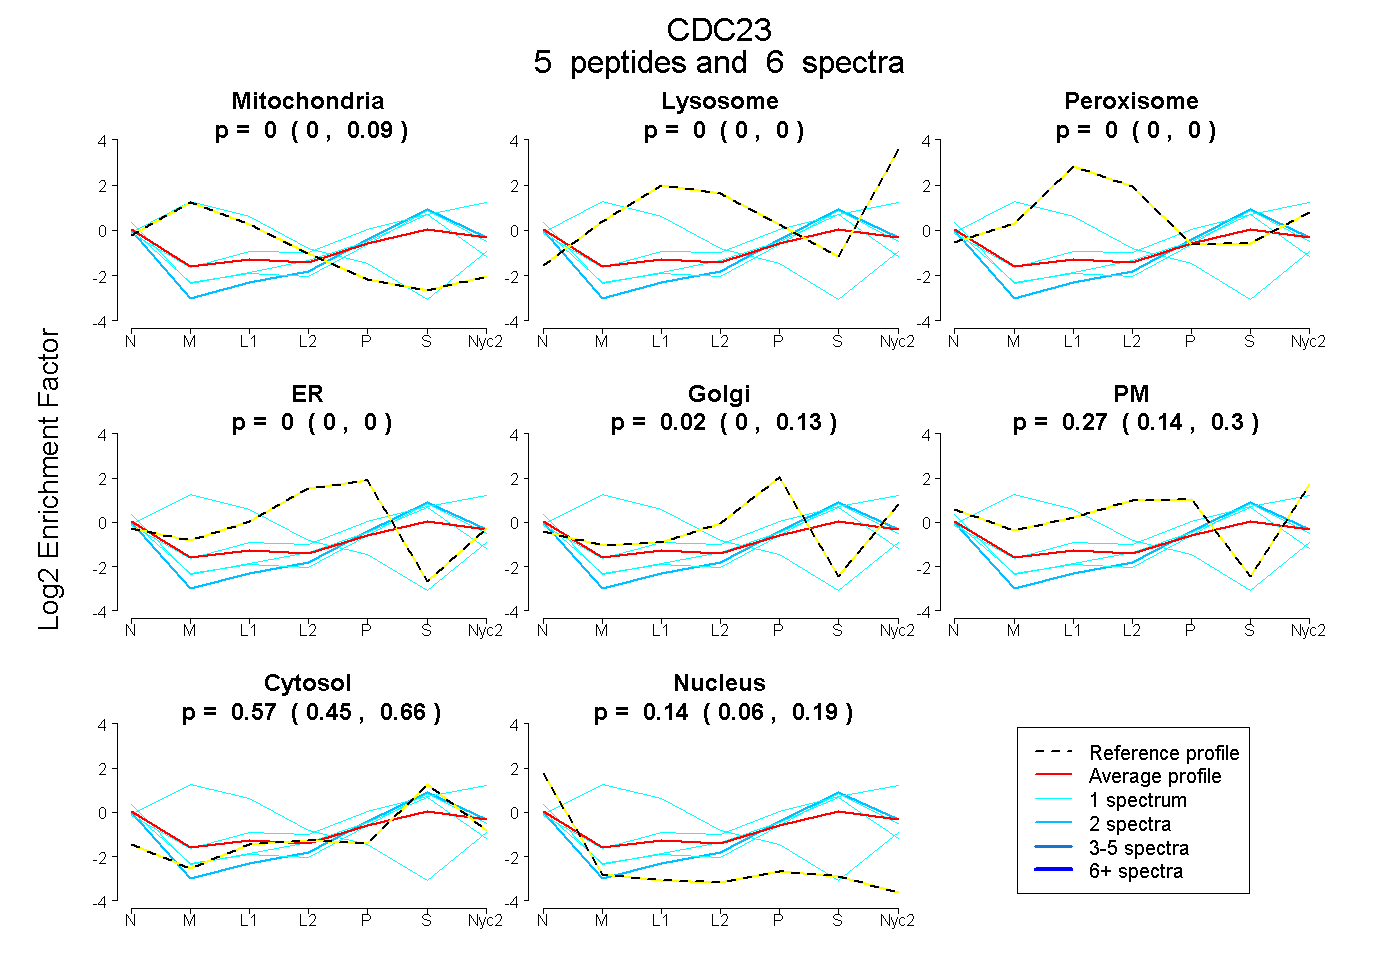
0.000 | 0.087
0.000 | 0.000
0.000 | 0.000
0.000 | 0.000
0.000 | 0.135
0.139 | 0.302
0.451 | 0.663
0.056 | 0.185
2peptides
spectra
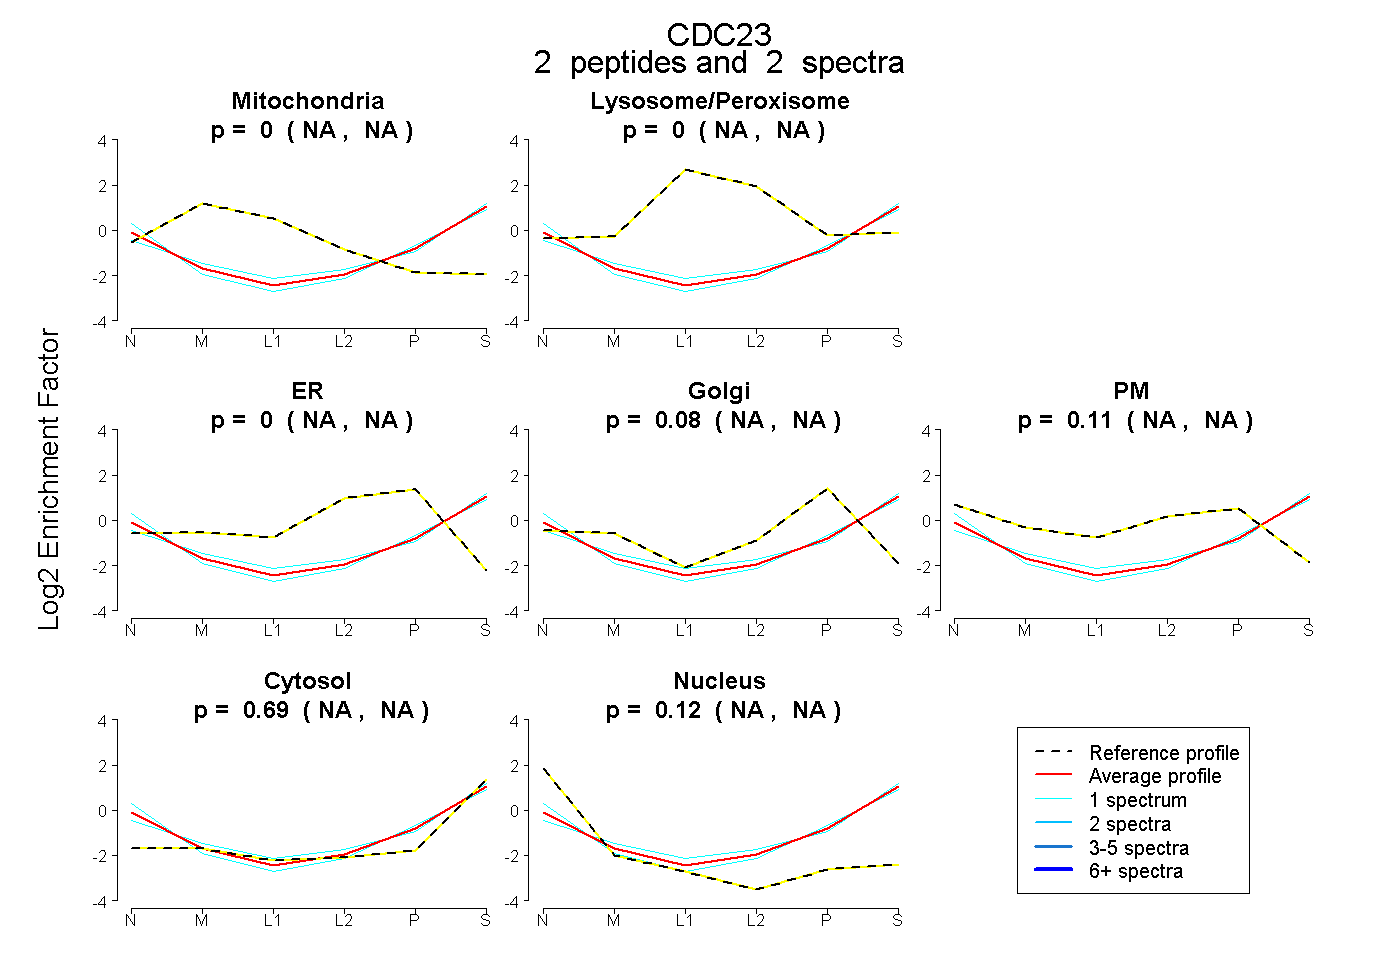
NA | NA
NA | NA
NA | NA
NA | NA
NA | NA
NA | NA
NA | NA
1peptide
spectrum
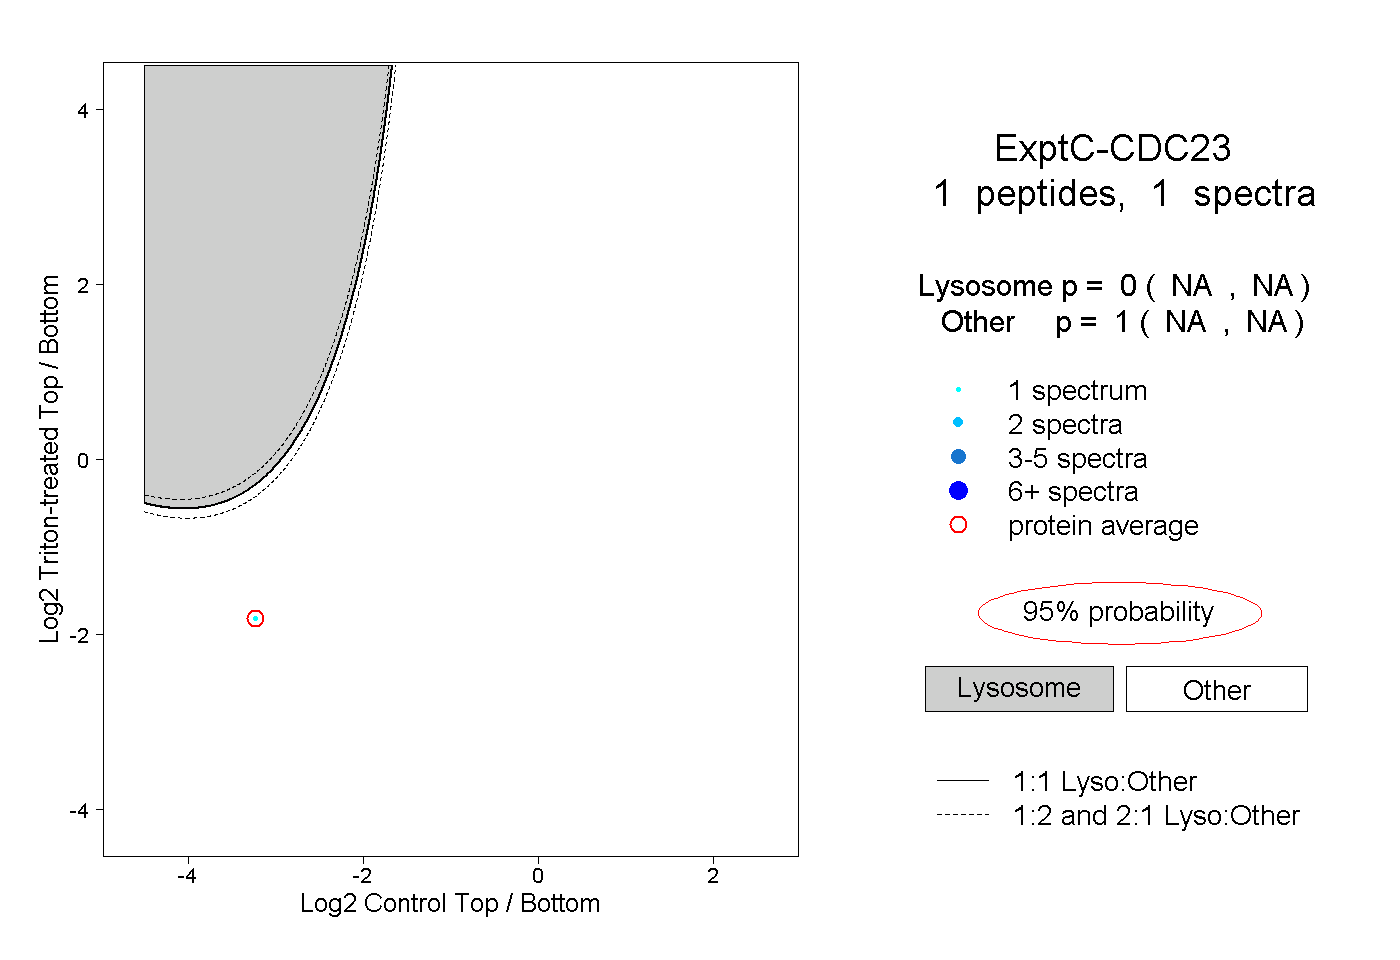
NA | NA
NA | NA