 5
5peptides
spectra
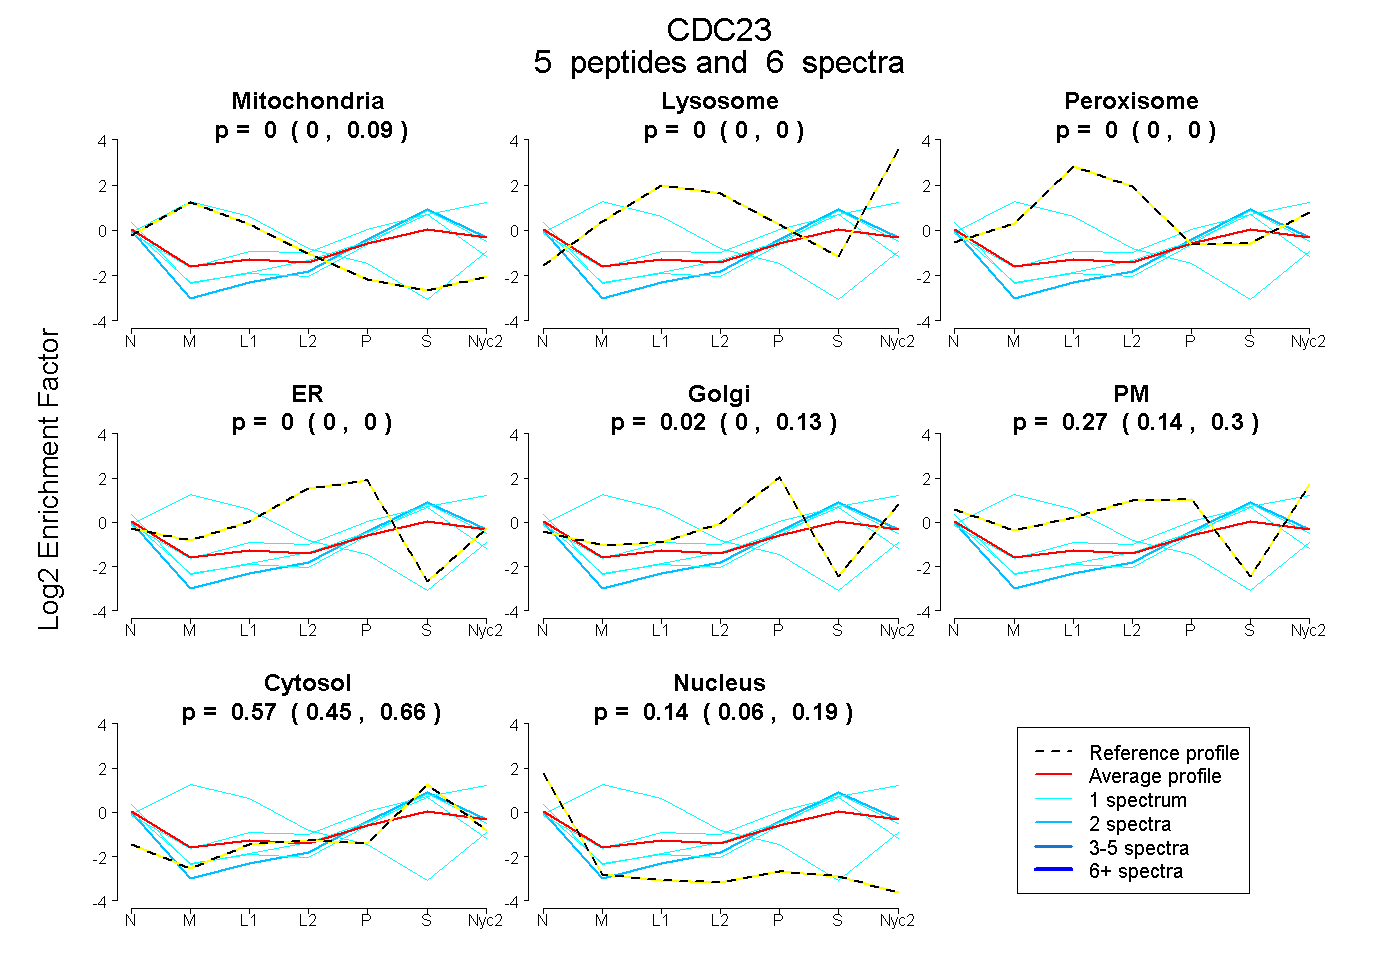
0.000 | 0.087
0.000 | 0.000
0.000 | 0.000
0.000 | 0.000
0.000 | 0.135
0.139 | 0.302
0.451 | 0.663
0.056 | 0.185
| Plot | Mito | Lyso | Perox | ER | Golgi | PM | Cytosol | Nucleus | |||||
| Expt A |
5 peptides |
6 spectra |
|
0.000 0.000 | 0.087 |
0.000 0.000 | 0.000 |
0.000 0.000 | 0.000 |
0.000 0.000 | 0.000 |
0.021 0.000 | 0.135 |
0.269 0.139 | 0.302 |
0.575 0.451 | 0.663 |
0.136 0.056 | 0.185 |
| 1 spectrum, QLLLIAGLTR | 0.000 | 0.000 | 0.000 | 0.000 | 0.137 | 0.000 | 0.730 | 0.132 | ||
| 2 spectra, ALSIFNELR | 0.000 | 0.000 | 0.000 | 0.000 | 0.133 | 0.000 | 0.751 | 0.116 | ||
| 1 spectrum, AALYFQR | 0.786 | 0.052 | 0.000 | 0.000 | 0.000 | 0.162 | 0.000 | 0.000 | ||
| 1 spectrum, NTSAAIQAYR | 0.000 | 0.000 | 0.000 | 0.000 | 0.128 | 0.033 | 0.663 | 0.177 | ||
| 1 spectrum, DDETVDSLGPLEK | 0.000 | 0.080 | 0.000 | 0.000 | 0.008 | 0.306 | 0.607 | 0.000 |
| Plot | Mito | Lyso or Perox | ER | Golgi | PM | Cytosol | Nucleus | ||||||
| Expt B |
2 peptides |
2 spectra |
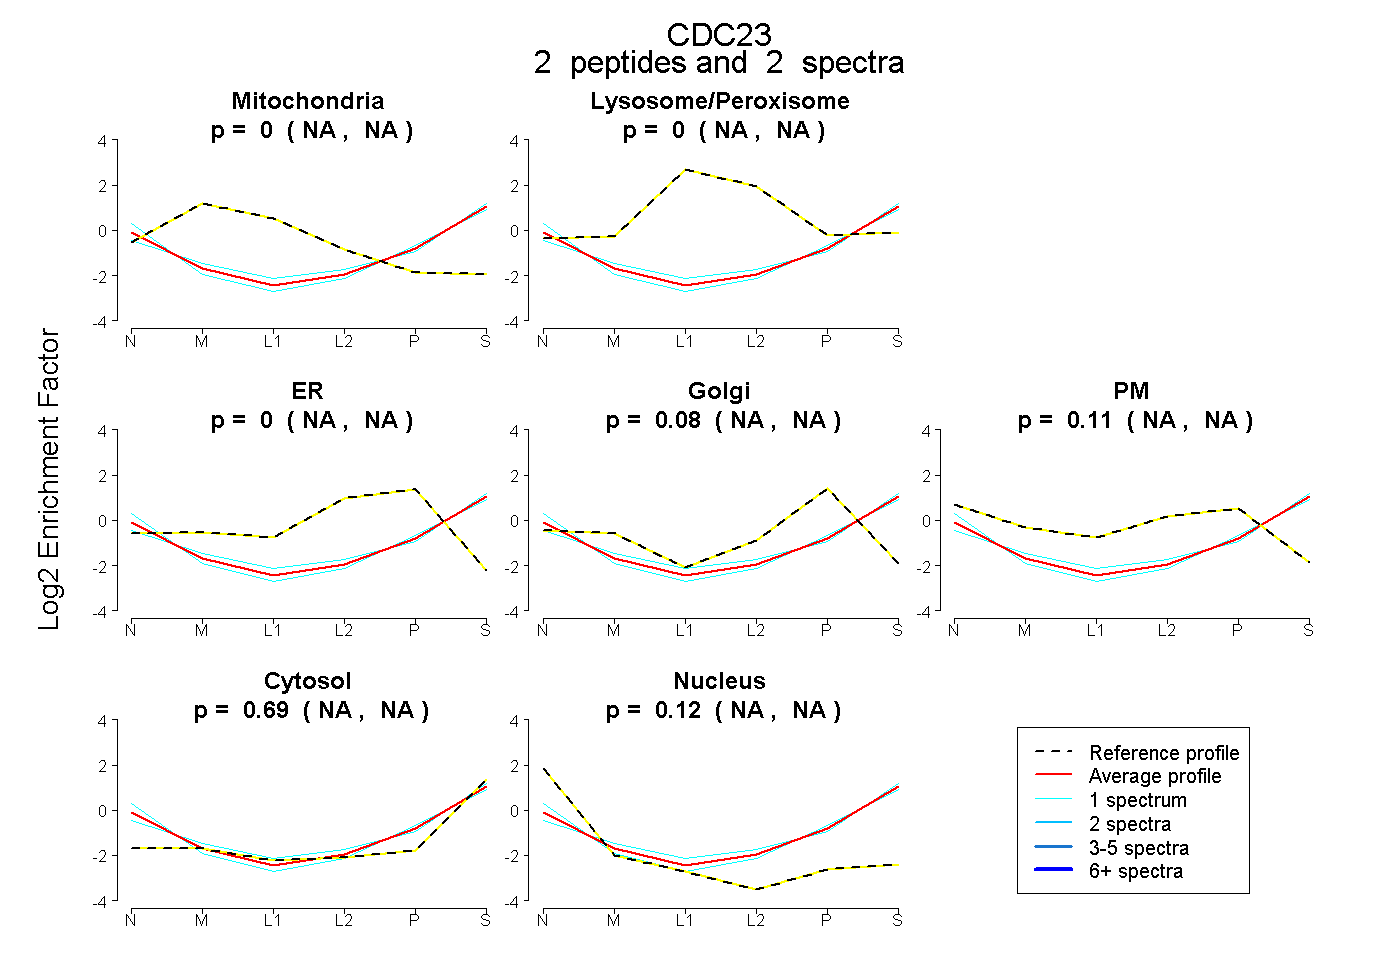 |
0.000 NA | NA |
0.000 NA | NA |
0.000 NA | NA |
0.082 NA | NA |
0.110 NA | NA |
0.692 NA | NA |
0.117 NA | NA |
|||
| Plot | Lyso | Other | |||||||||||
| Expt C |
1 peptide |
1 spectrum |
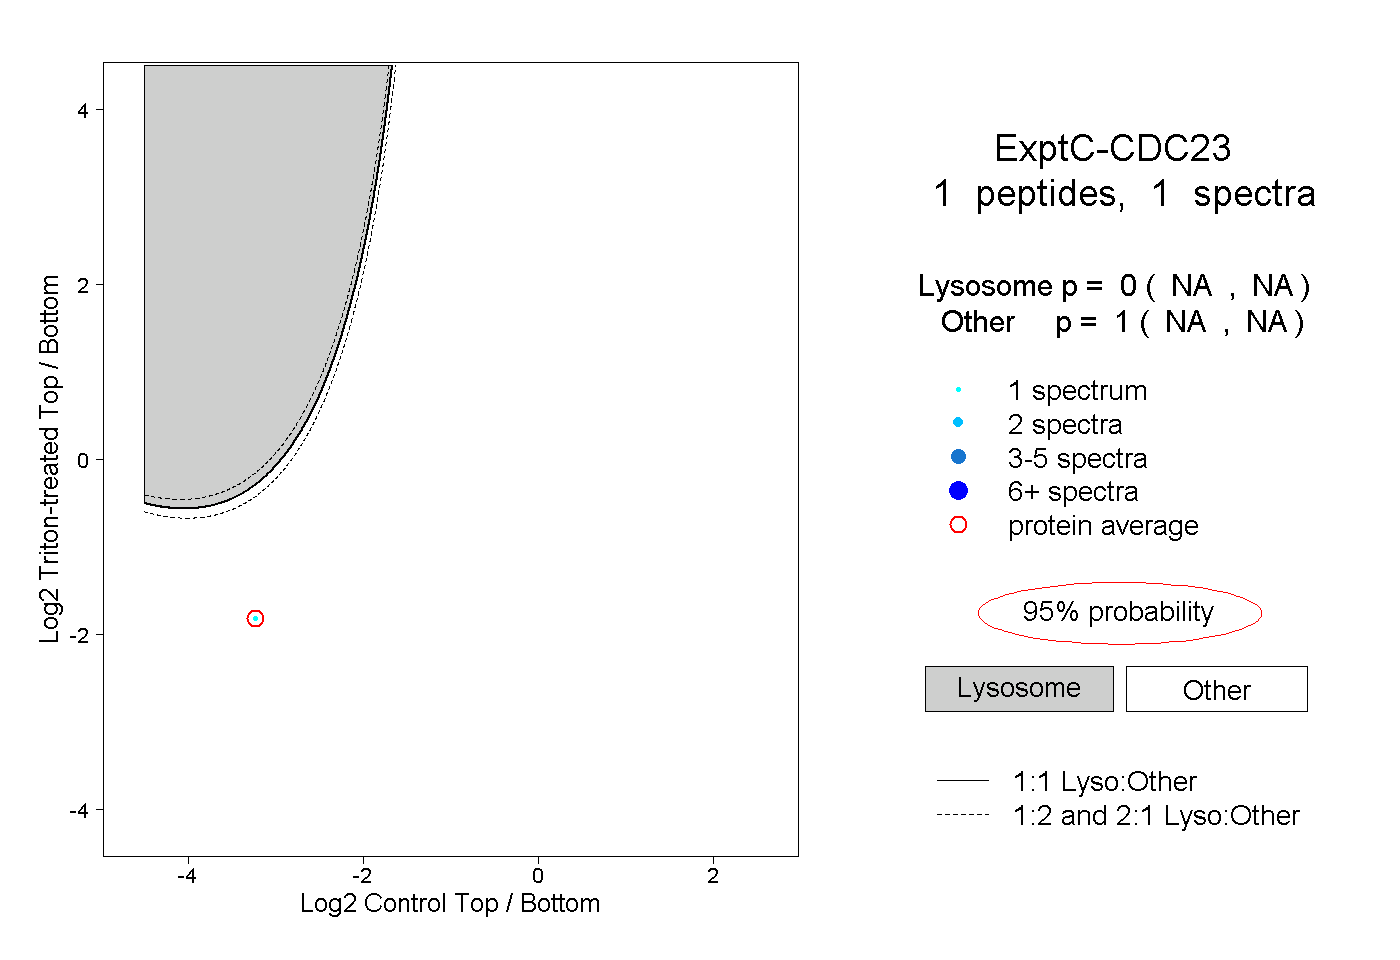 |
0.000 NA | NA |
1.000 NA | NA |