 5
5peptides
spectra
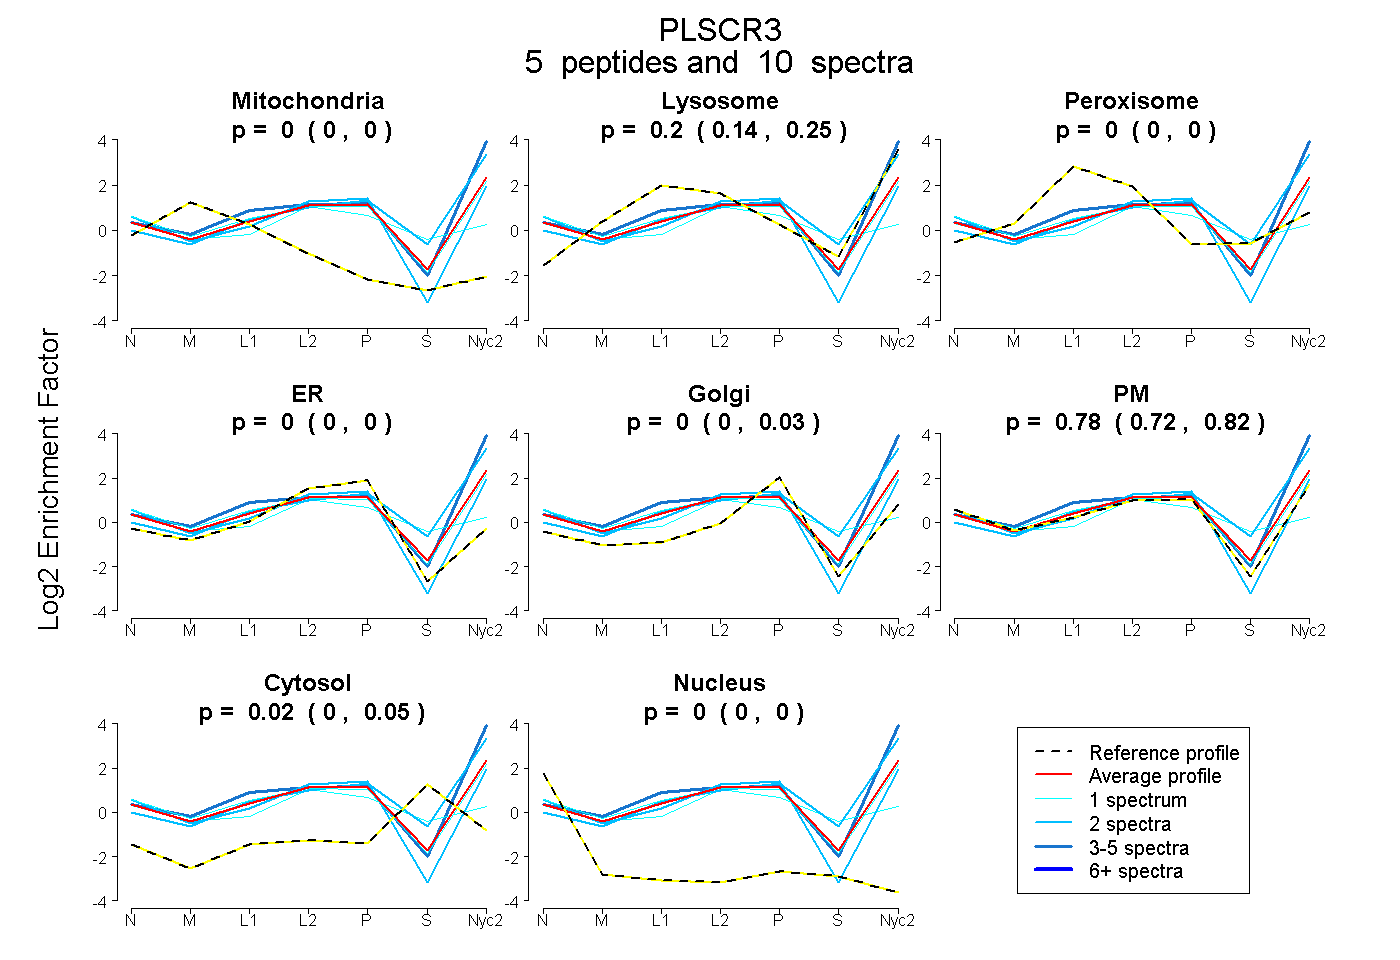
0.000 | 0.000
0.142 | 0.254
0.000 | 0.000
0.000 | 0.000
0.000 | 0.028
0.717 | 0.819
0.000 | 0.047
0.000 | 0.000
1peptide
spectra
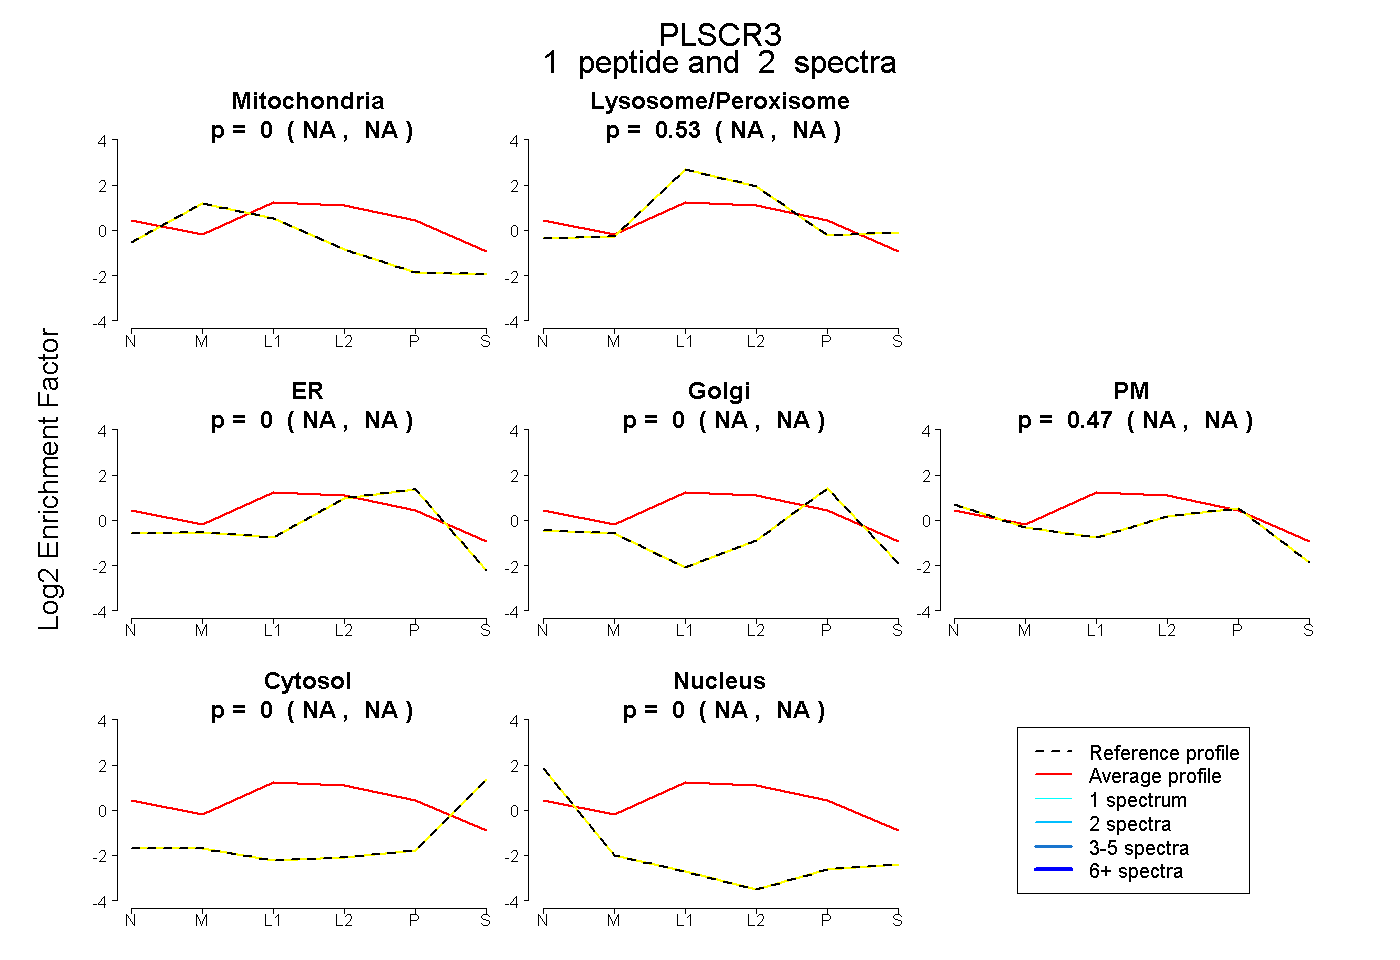
NA | NA
NA | NA
NA | NA
NA | NA
NA | NA
NA | NA
NA | NA
2peptides
spectra
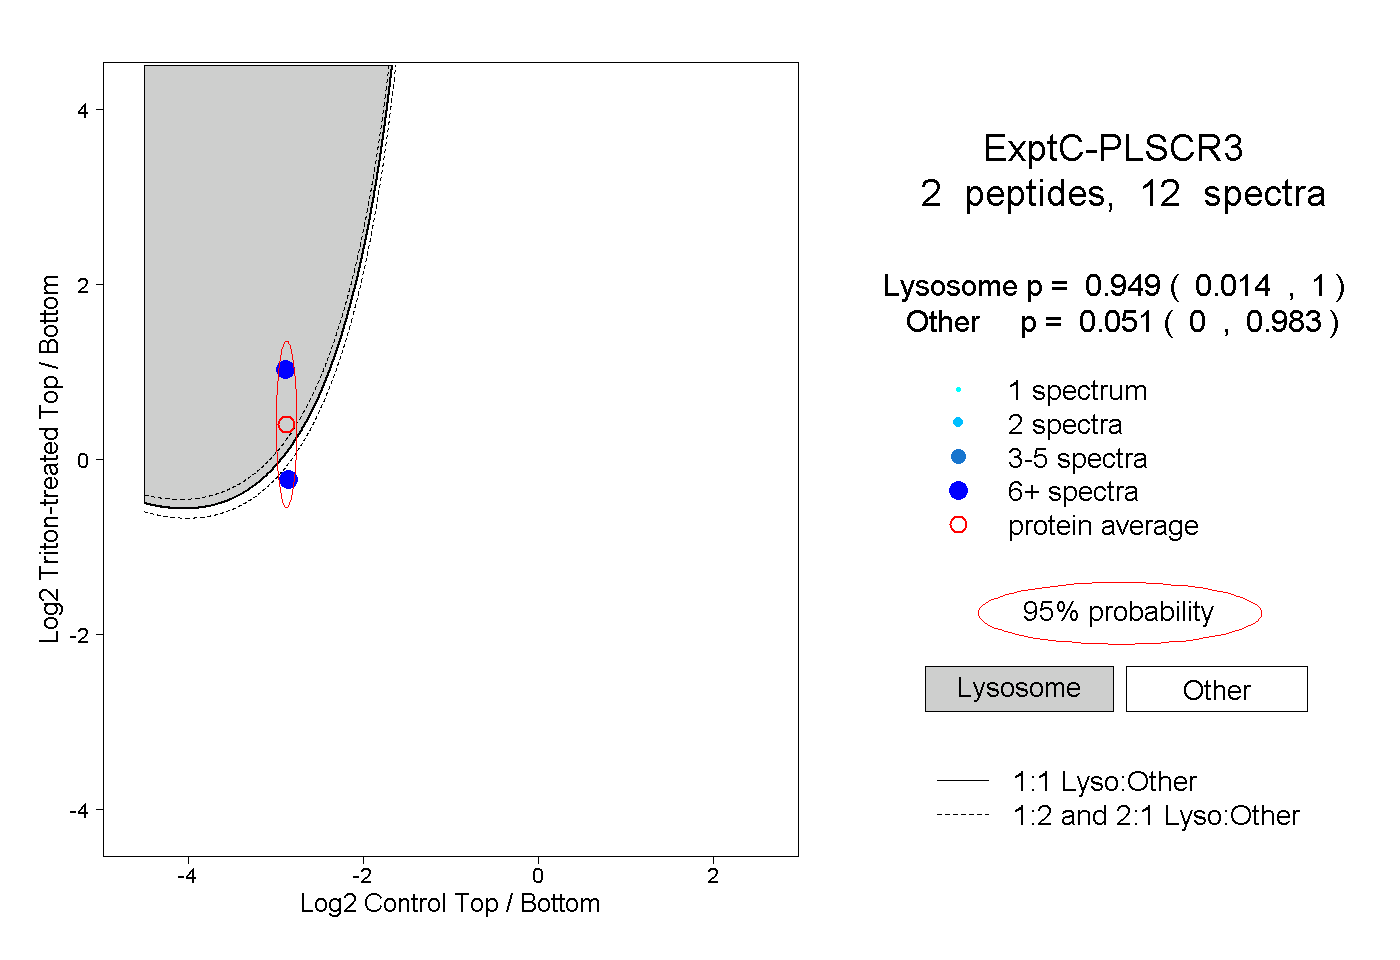
0.014 | 1.000
0.000 | 0.983