 5
5peptides
spectra
0.000 | 0.000
0.142 | 0.254
0.000 | 0.000
0.000 | 0.000
0.000 | 0.028
0.717 | 0.819
0.000 | 0.047
0.000 | 0.000
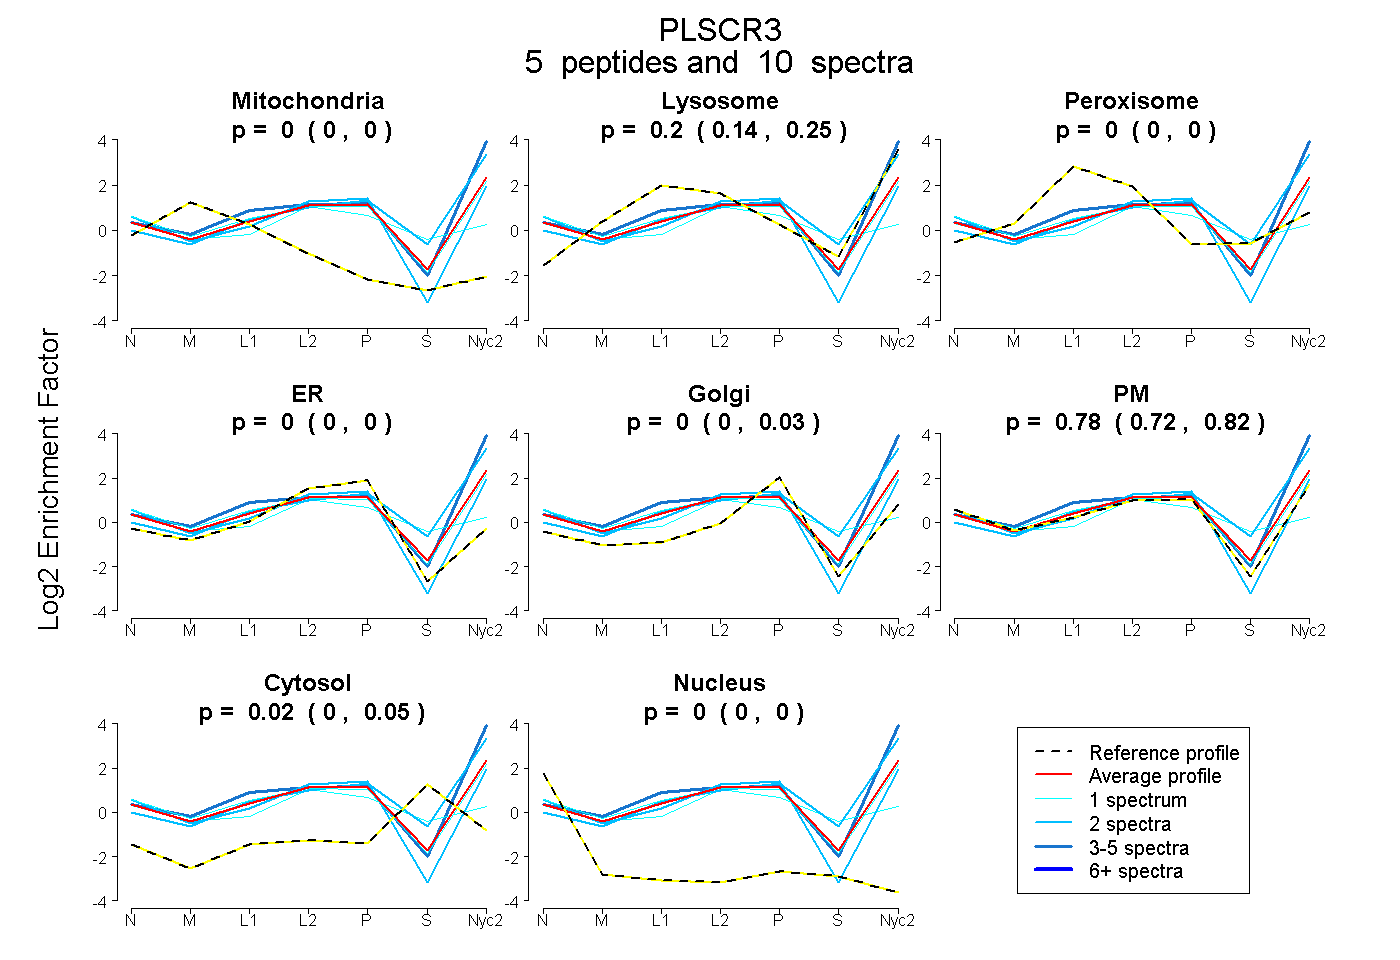
| Plot | Mito | Lyso | Perox | ER | Golgi | PM | Cytosol | Nucleus | |||||
| Expt A |
5 peptides |
10 spectra |
|
0.000 0.000 | 0.000 |
0.201 0.142 | 0.254 |
0.000 0.000 | 0.000 |
0.000 0.000 | 0.000 |
0.000 0.000 | 0.028 |
0.780 0.717 | 0.819 |
0.019 0.000 | 0.047 |
0.000 0.000 | 0.000 |
| 2 spectra, LADPGDR | 0.000 | 0.492 | 0.000 | 0.000 | 0.095 | 0.358 | 0.056 | 0.000 | ||
| 1 spectrum, VETFLGWETCNR | 0.000 | 0.159 | 0.004 | 0.000 | 0.000 | 0.837 | 0.000 | 0.000 | ||
| 4 spectra, FSILDADR | 0.000 | 0.455 | 0.000 | 0.000 | 0.000 | 0.545 | 0.000 | 0.000 | ||
| 2 spectra, QWGGLLR | 0.000 | 0.000 | 0.000 | 0.029 | 0.000 | 0.971 | 0.000 | 0.000 | ||
| 1 spectrum, GGAGPSAITS | 0.000 | 0.000 | 0.179 | 0.228 | 0.000 | 0.333 | 0.260 | 0.000 |
| Plot | Mito | Lyso or Perox | ER | Golgi | PM | Cytosol | Nucleus | ||||||
| Expt B |
1 peptide |
2 spectra |
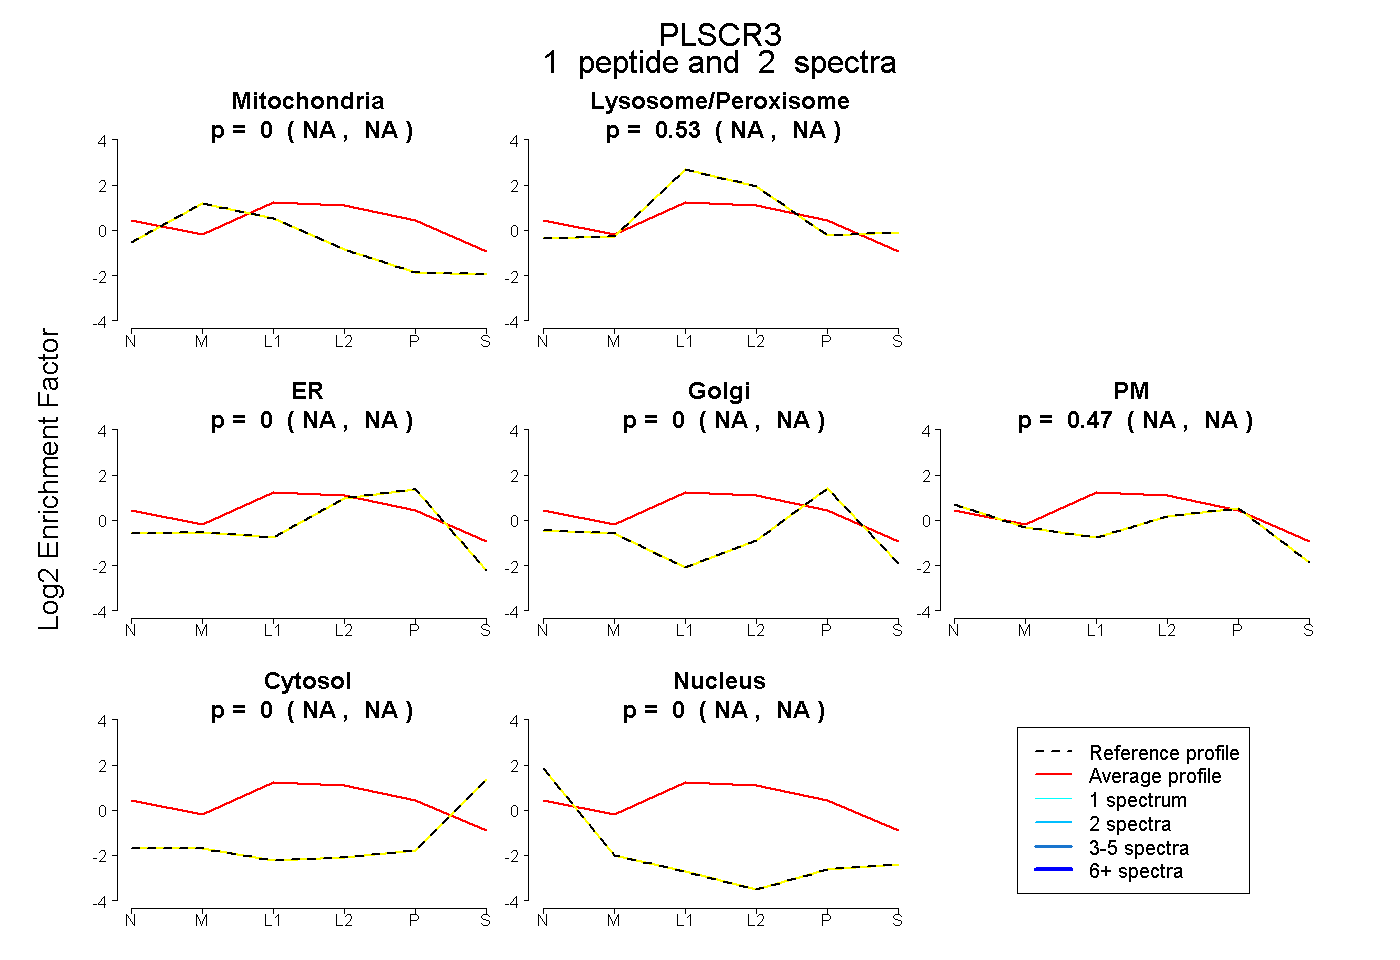 |
0.000 NA | NA |
0.534 NA | NA |
0.000 NA | NA |
0.000 NA | NA |
0.466 NA | NA |
0.000 NA | NA |
0.000 NA | NA |
|||
| Plot | Lyso | Other | |||||||||||
| Expt C |
2 peptides |
12 spectra |
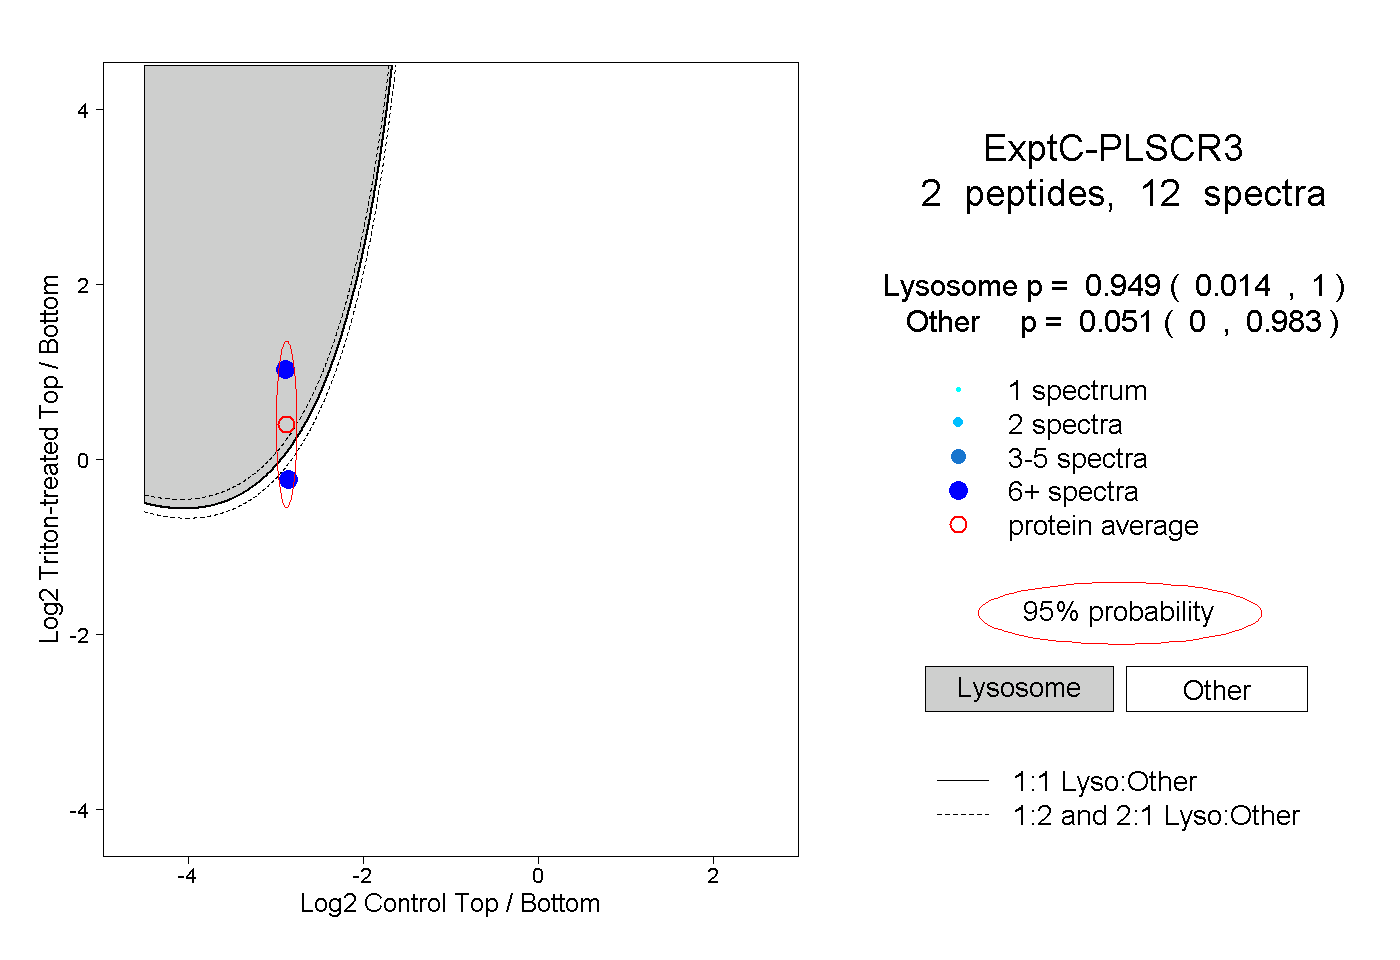 |
0.949 0.014 | 1.000 |
0.051 0.000 | 0.983 |