 8
8peptides
spectra
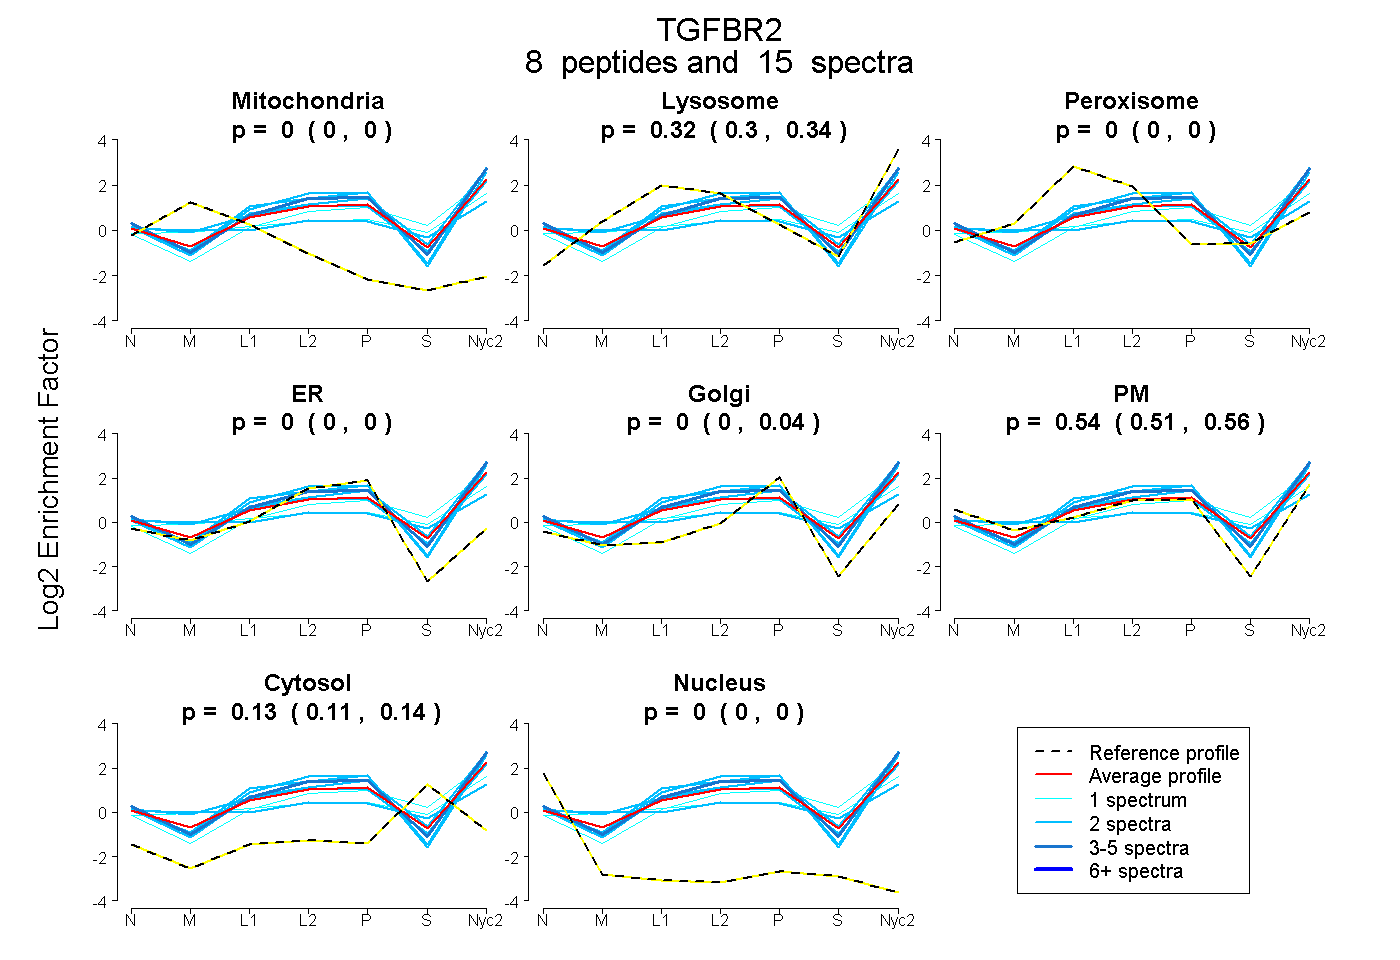
0.000 | 0.000
0.304 | 0.340
0.000 | 0.000
0.000 | 0.000
0.000 | 0.036
0.510 | 0.557
0.113 | 0.144
0.000 | 0.000
14peptides
spectra
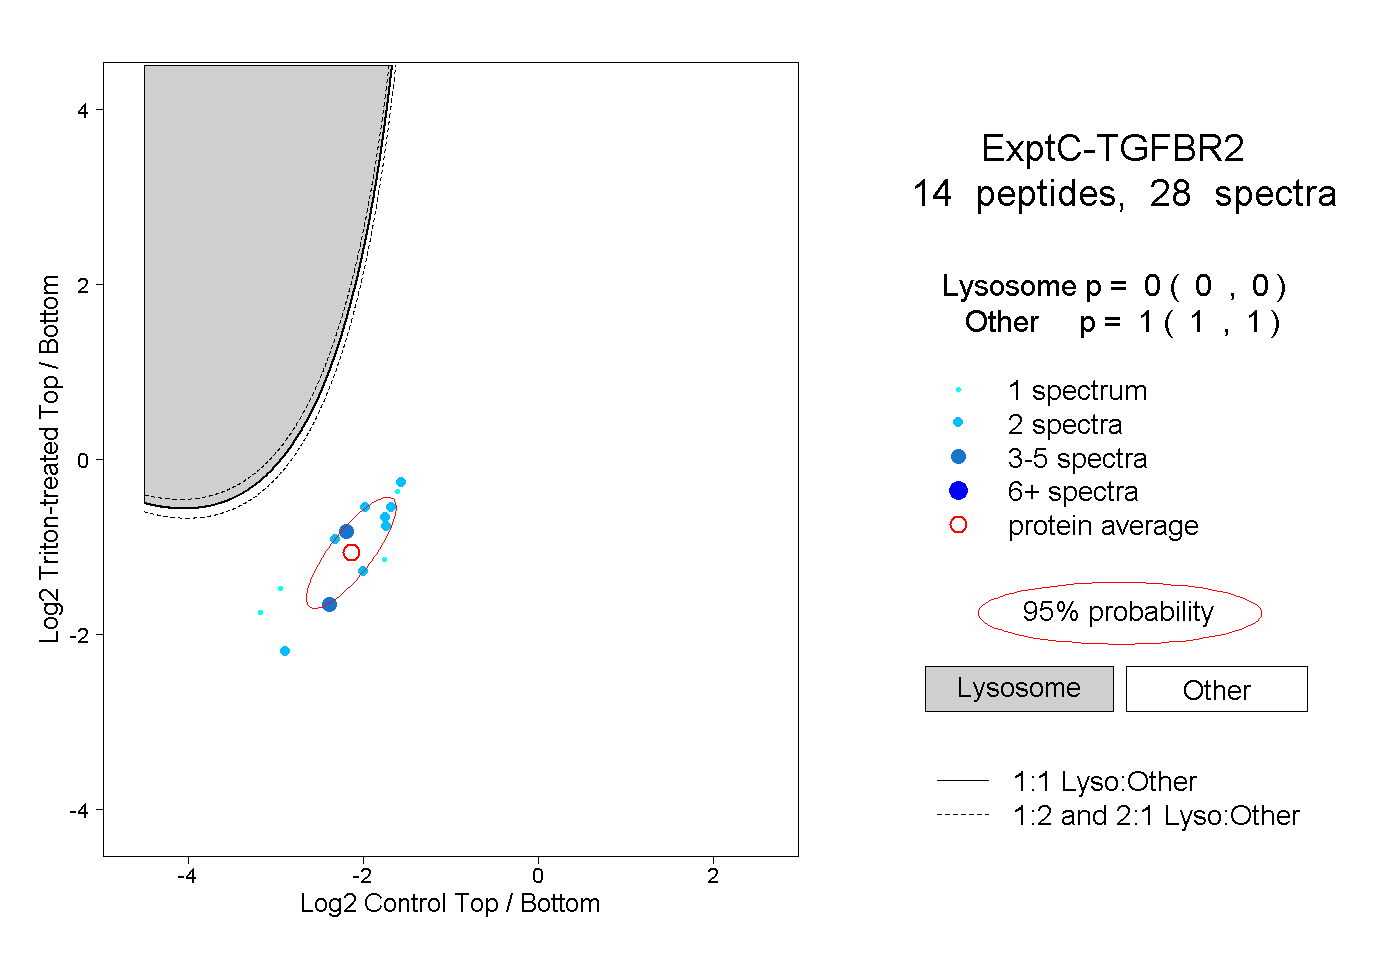
0.000 | 0.000
1.000 | 1.000
2peptides
spectra
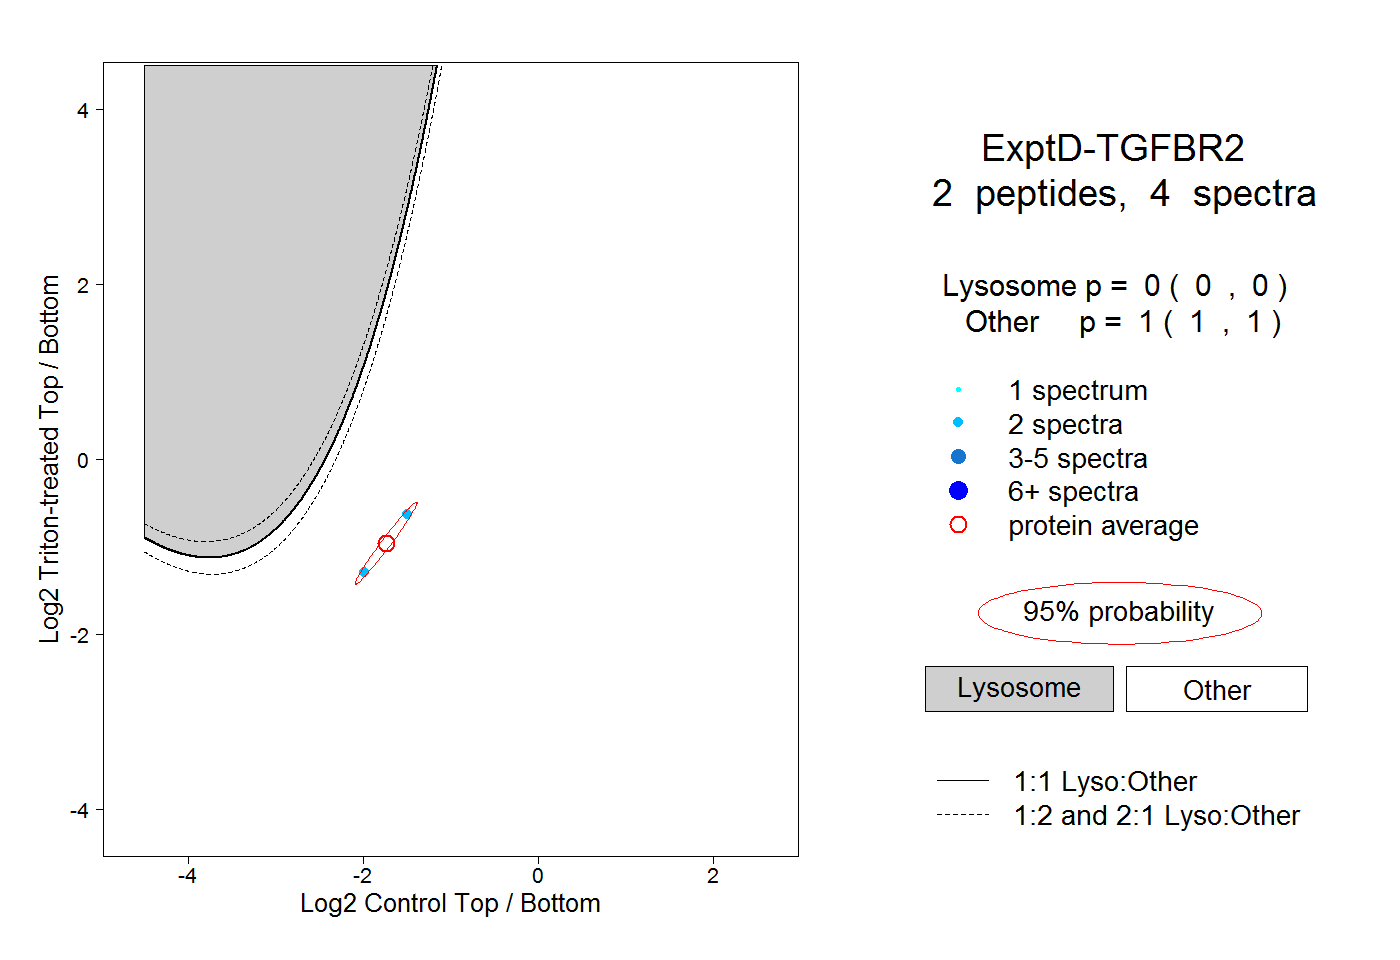
0.000 | 0.000
1.000 | 1.000