 8
8peptides
spectra
0.000 | 0.000
0.304 | 0.340
0.000 | 0.000
0.000 | 0.000
0.000 | 0.036
0.510 | 0.557
0.113 | 0.144
0.000 | 0.000
14peptides
spectra
0.000 | 0.000
1.000 | 1.000
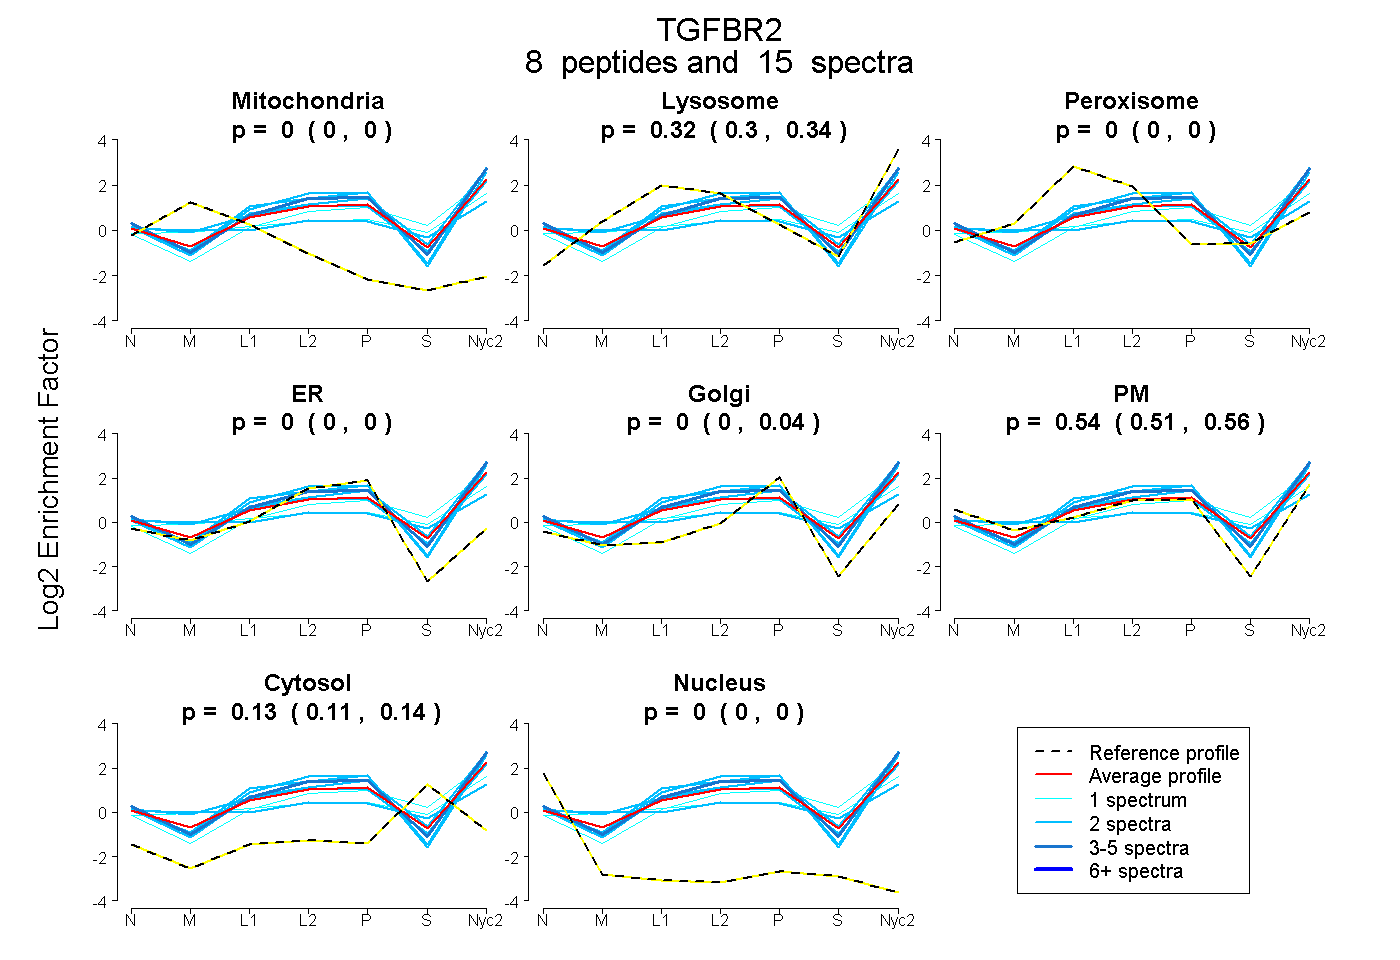
| Plot | Mito | Lyso | Perox | ER | Golgi | PM | Cytosol | Nucleus | |||||
| Expt A |
8 peptides |
15 spectra |
|
0.000 0.000 | 0.000 |
0.321 0.304 | 0.340 |
0.000 0.000 | 0.000 |
0.000 0.000 | 0.000 |
0.002 0.000 | 0.036 |
0.545 0.510 | 0.557 |
0.132 0.113 | 0.144 |
0.000 0.000 | 0.000 |
||
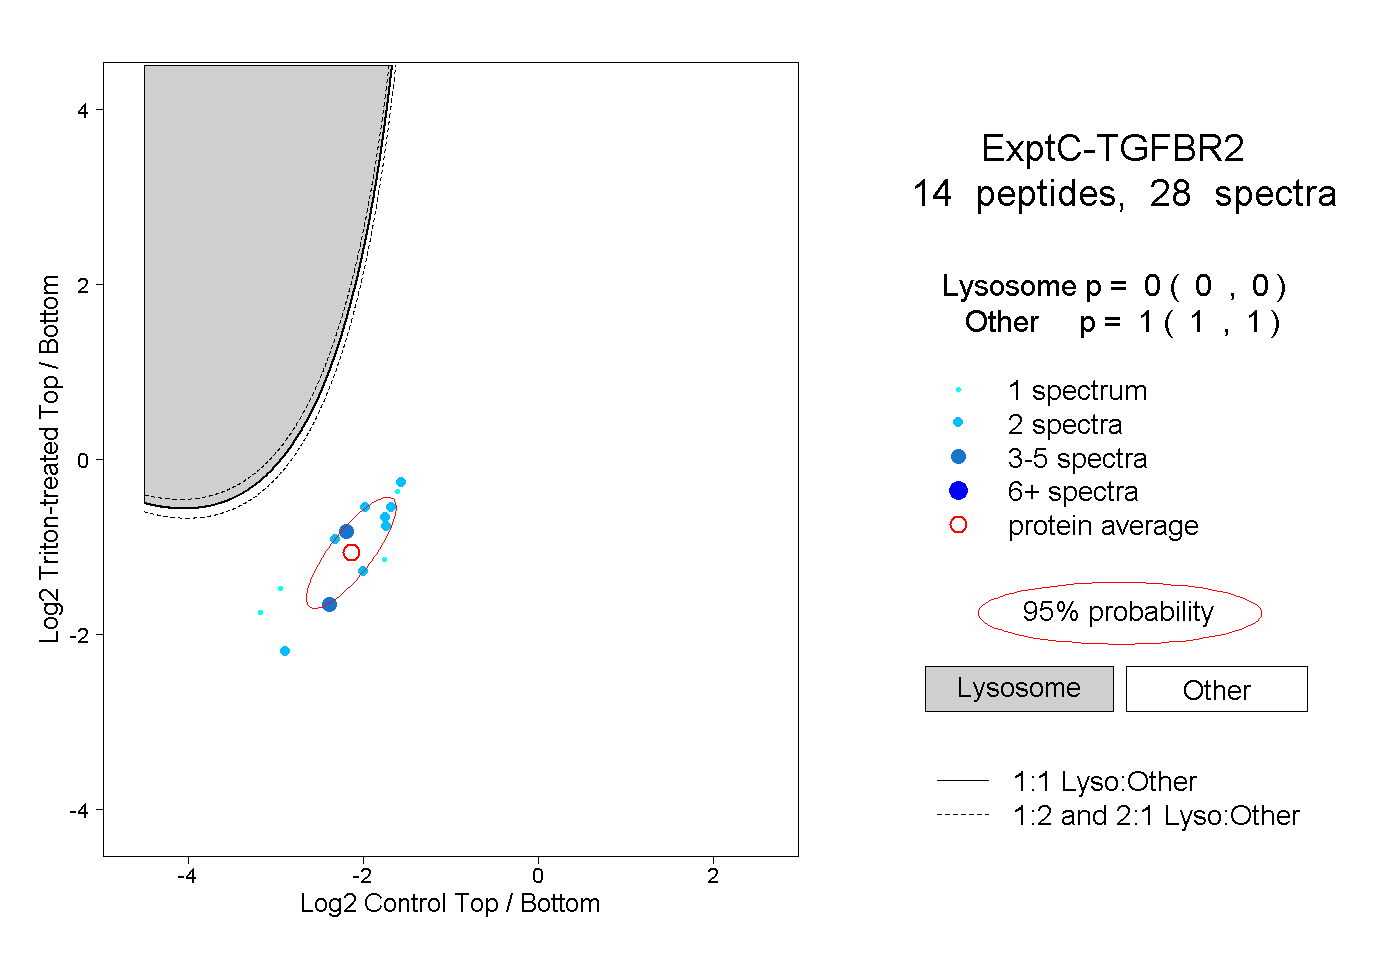
| Plot | Lyso | Other | |||||||||||
| Expt C |
14 peptides |
28 spectra |
|
0.000 0.000 | 0.000 |
1.000 1.000 | 1.000 |
| 2 spectra, IPEDGSLNTTK | 0.000 | 1.000 | ||||||||
| 2 spectra, CNAVGEVK | 0.000 | 1.000 | ||||||||
| 2 spectra, MPIVHR | 0.000 | 1.000 | ||||||||
| 1 spectrum, QYWLITAFHAK | 0.000 | 1.000 | ||||||||
| 5 spectra, LSPSWESSKPR | 0.000 | 1.000 | ||||||||
| 3 spectra, LGSSLAR | 0.000 | 1.000 | ||||||||
| 2 spectra, FAEVYK | 0.000 | 1.000 | ||||||||
| 2 spectra, HVISWEDLR | 0.000 | 1.000 | ||||||||
| 2 spectra, LTAQCVAER | 0.000 | 1.000 | ||||||||
| 1 spectrum, SCSQEK | 0.000 | 1.000 | ||||||||
| 1 spectrum, FCDVTLSTCDNQK | 0.000 | 1.000 | ||||||||
| 2 spectra, GNLQEYLTR | 0.000 | 1.000 | ||||||||
| 1 spectrum, IFPYEEYSSWK | 0.000 | 1.000 | ||||||||
| 2 spectra, DYEPPFGSK | 0.000 | 1.000 |
| Plot | Lyso | Other | |||||||||||
| Expt D |
2 peptides |
4 spectra |
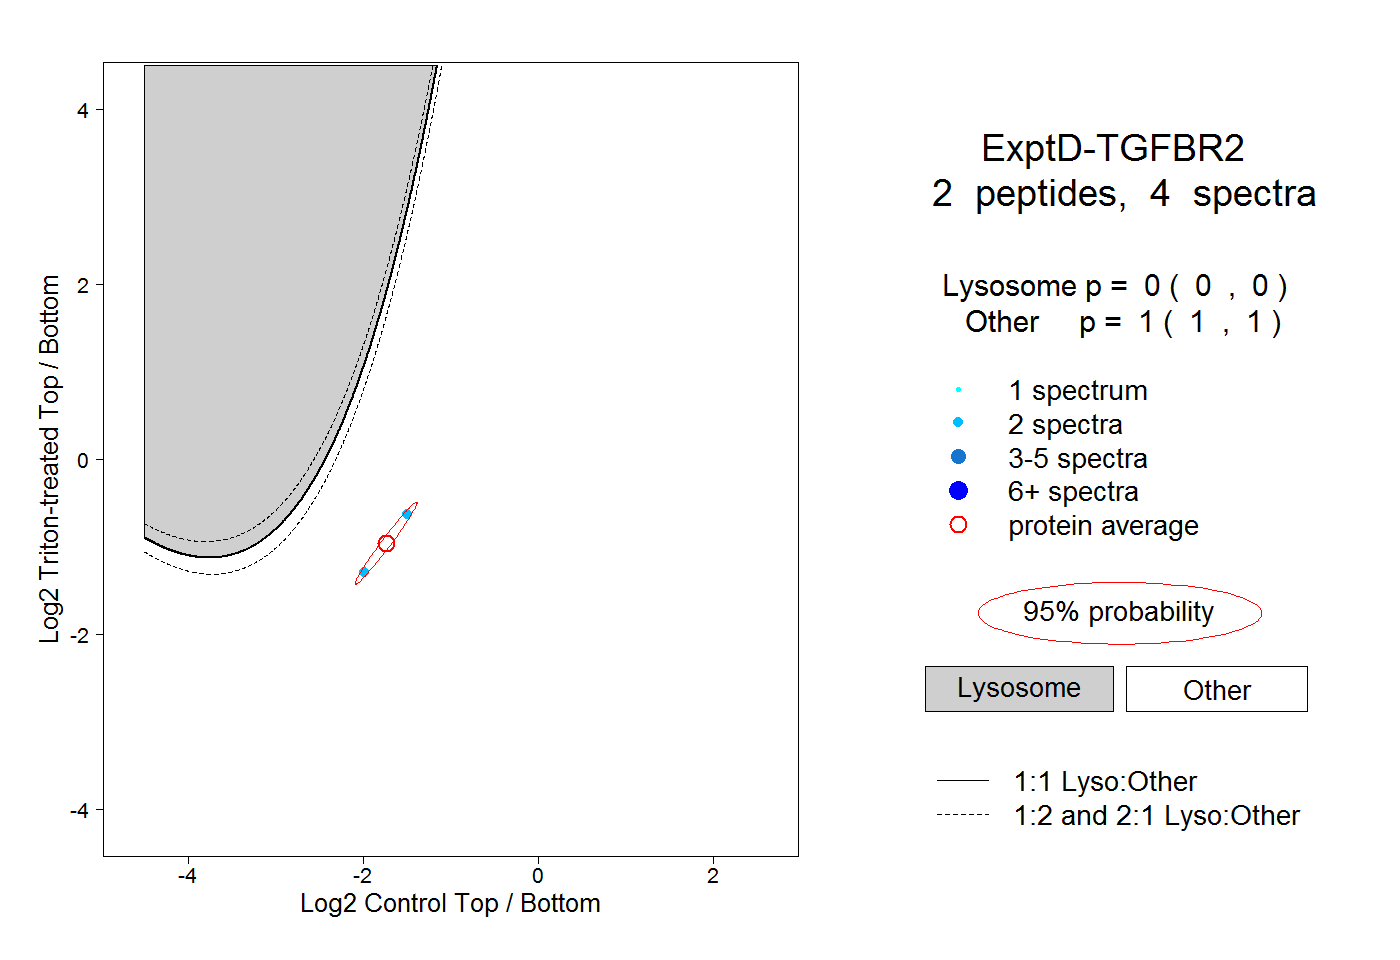 |
0.000 0.000 | 0.000 |
1.000 1.000 | 1.000 |