 7
7peptides
spectra
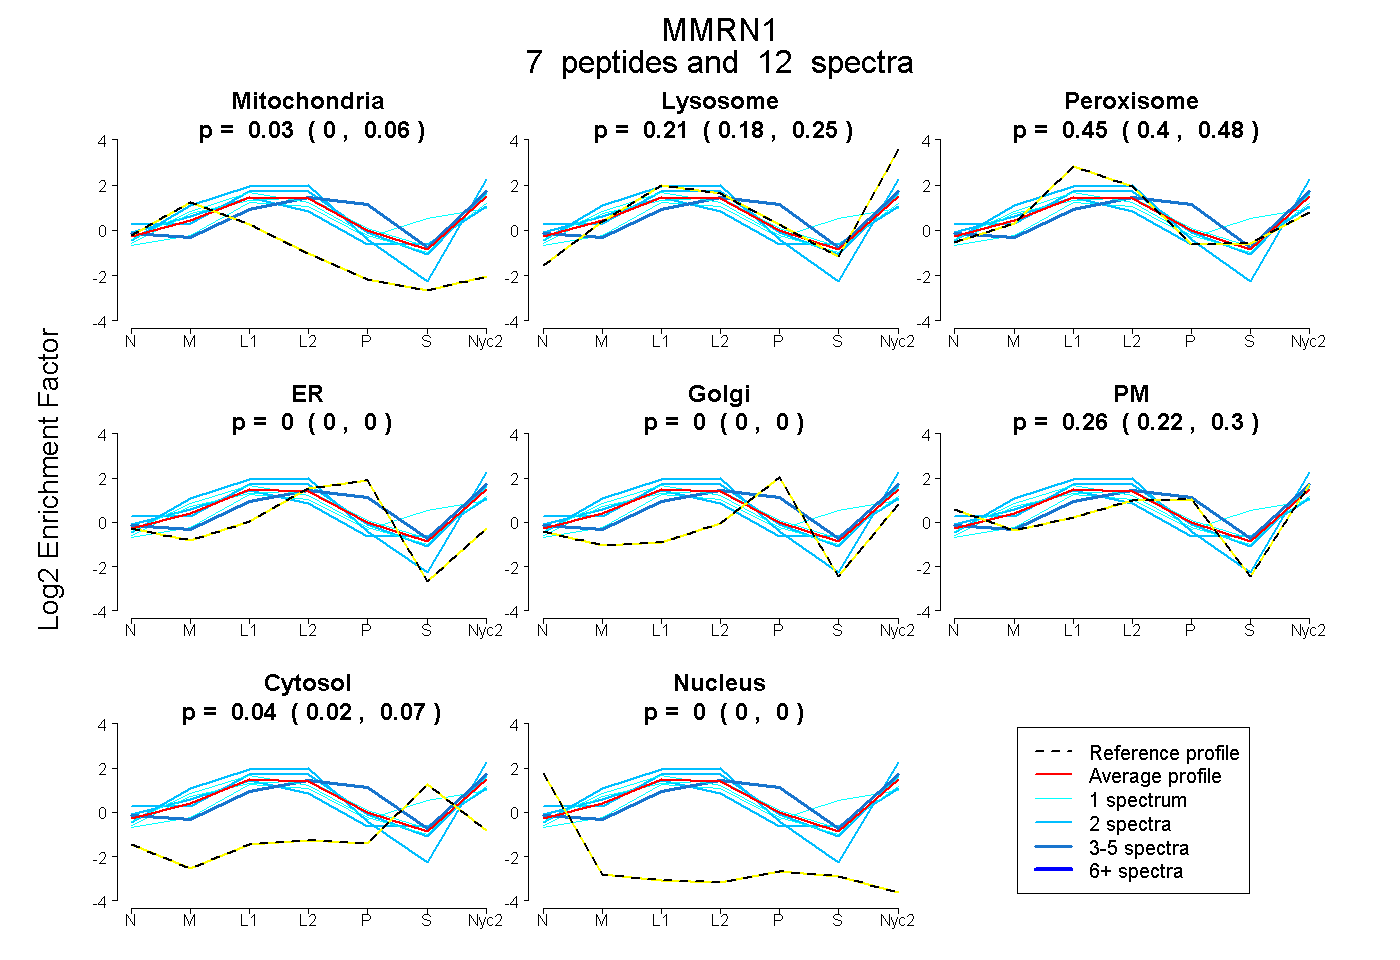
0.000 | 0.062
0.175 | 0.246
0.404 | 0.481
0.000 | 0.000
0.000 | 0.000
0.222 | 0.299
0.018 | 0.066
0.000 | 0.000
1peptide
spectrum
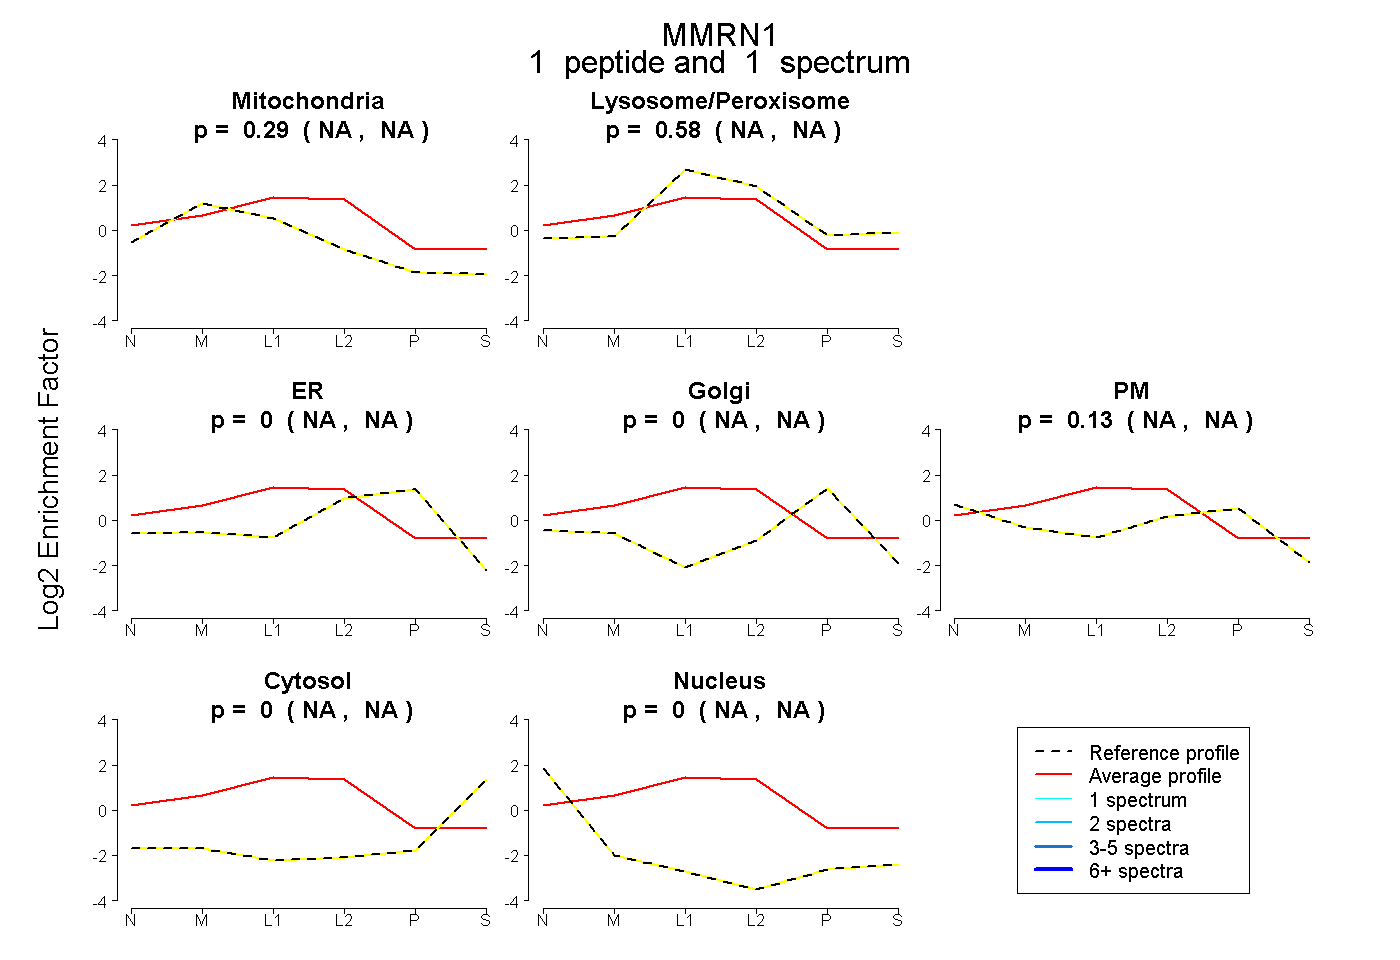
NA | NA
NA | NA
NA | NA
NA | NA
NA | NA
NA | NA
NA | NA
20peptides
spectra
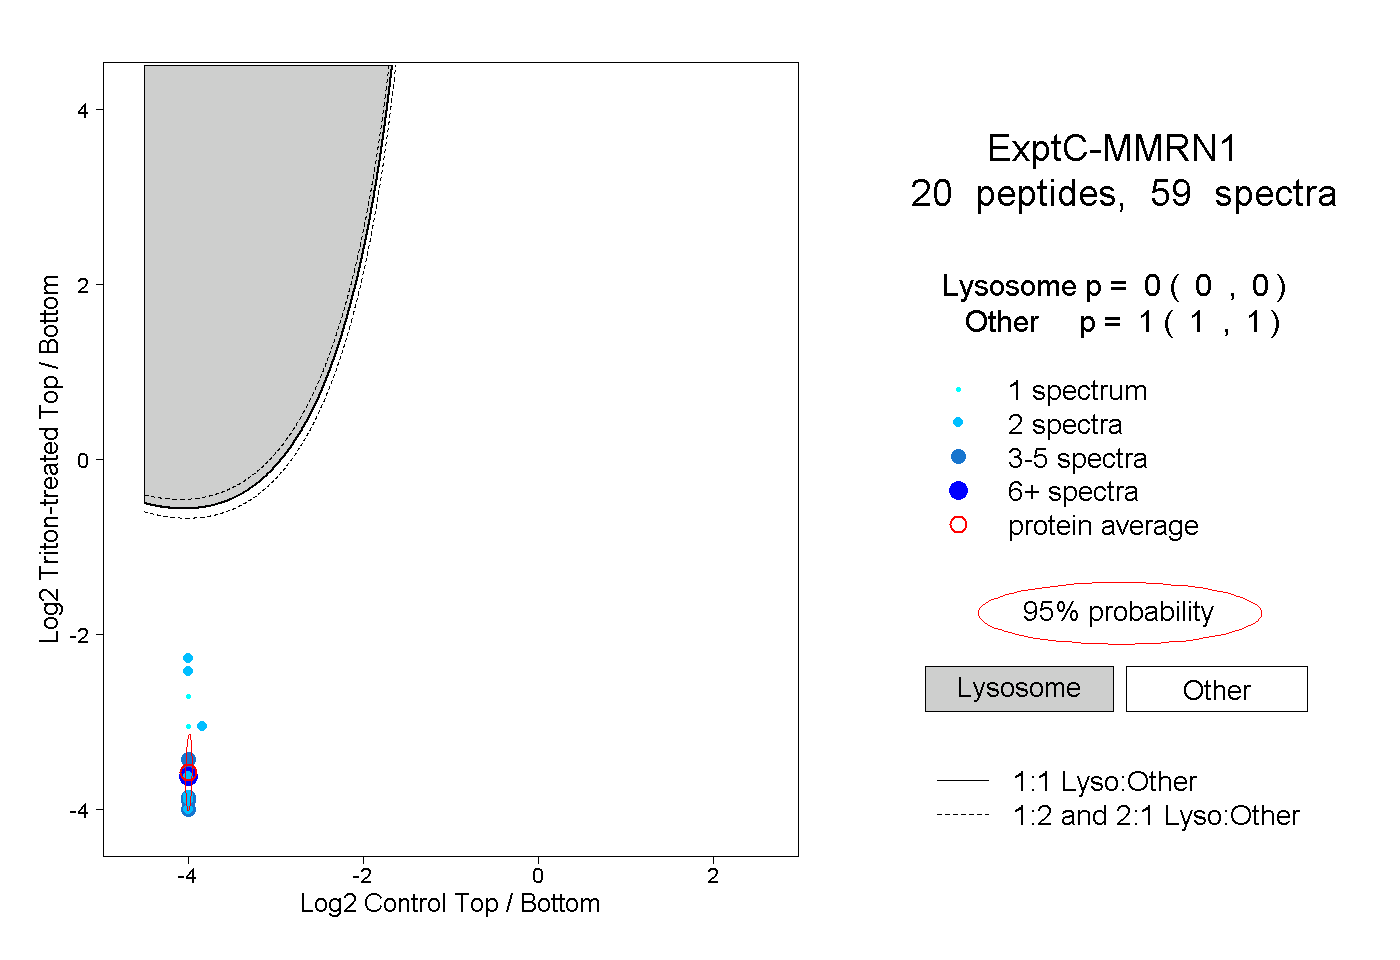
0.000 | 0.000
1.000 | 1.000