 8
8peptides
spectra
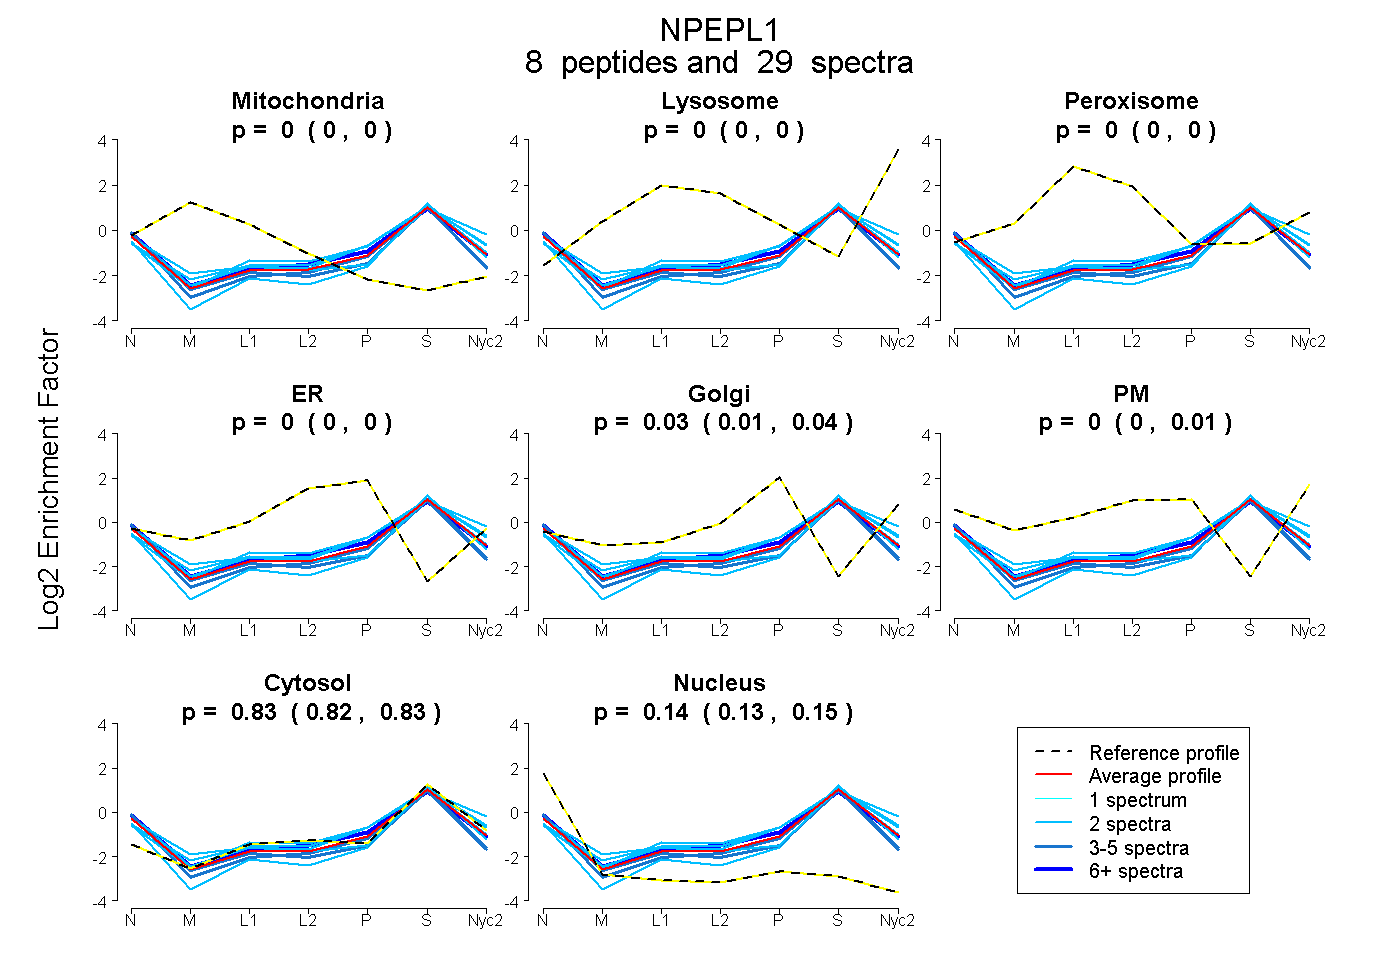
0.000 | 0.000
0.000 | 0.000
0.000 | 0.000
0.000 | 0.000
0.011 | 0.036
0.000 | 0.014
0.824 | 0.833
0.134 | 0.145
3peptides
spectra
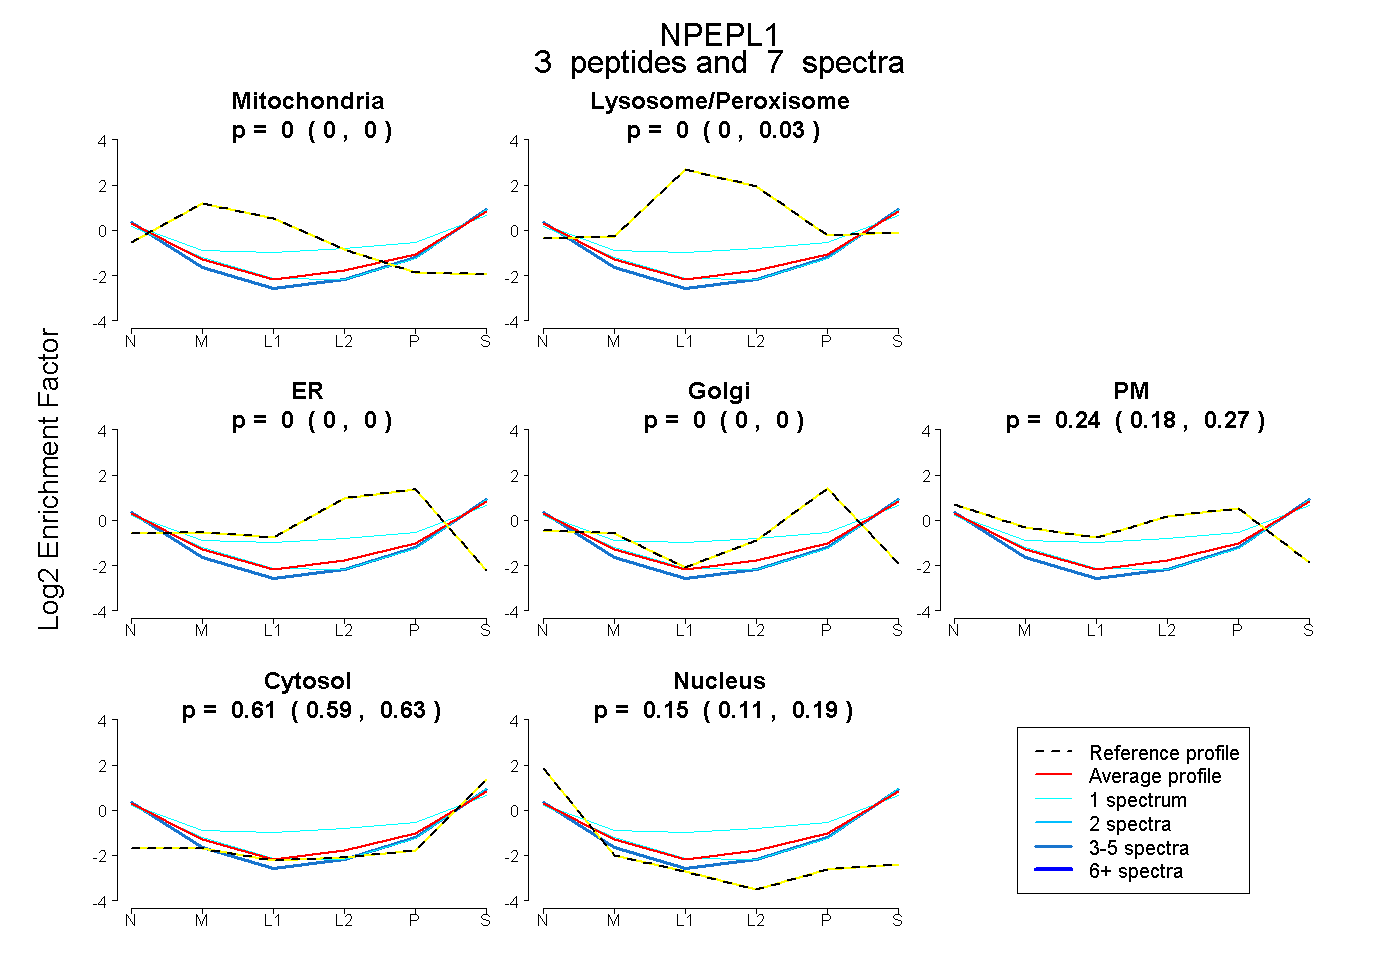
0.000 | 0.000
0.000 | 0.026
0.000 | 0.000
0.000 | 0.000
0.175 | 0.270
0.593 | 0.628
0.112 | 0.186
5peptides
spectra
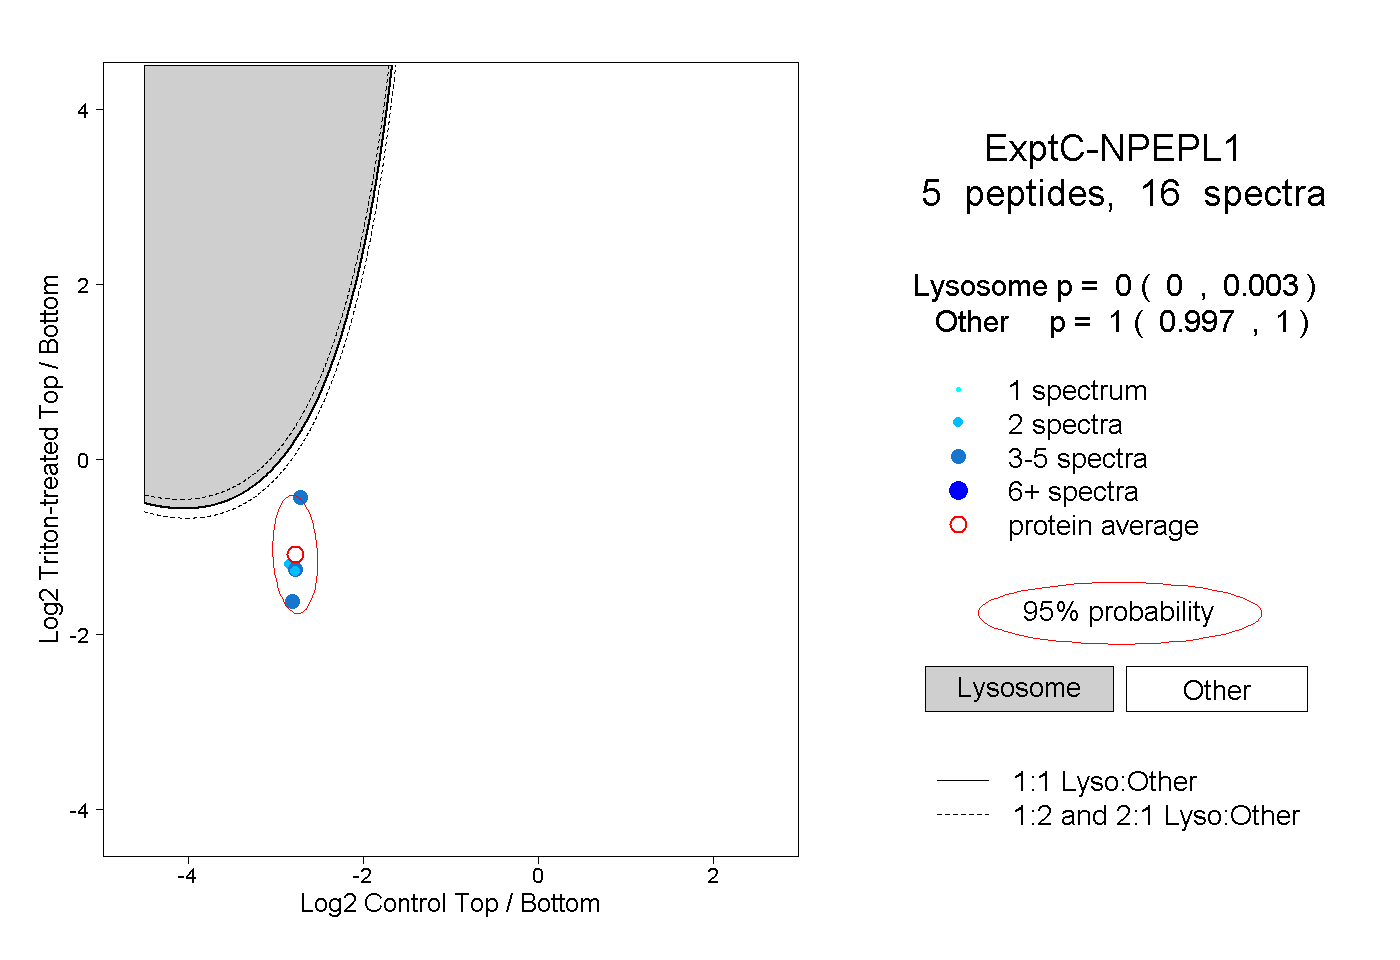
0.000 | 0.003
0.997 | 1.000