 8
8peptides
spectra
0.000 | 0.000
0.000 | 0.000
0.000 | 0.000
0.000 | 0.000
0.011 | 0.036
0.000 | 0.014
0.824 | 0.833
0.134 | 0.145
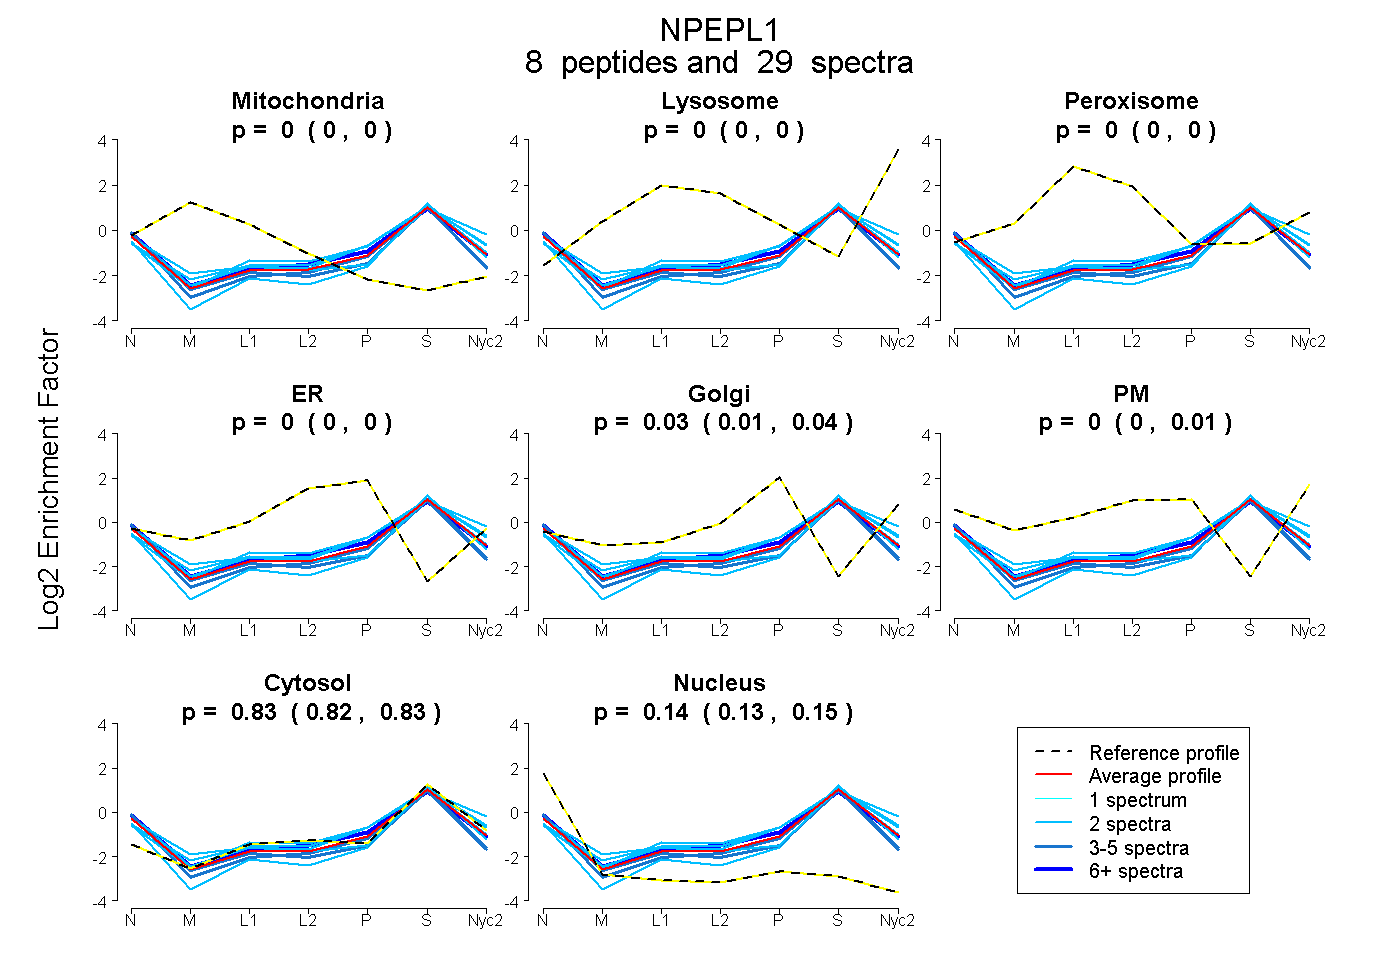
| Plot | Mito | Lyso | Perox | ER | Golgi | PM | Cytosol | Nucleus | |||||
| Expt A |
8 peptides |
29 spectra |
|
0.000 0.000 | 0.000 |
0.000 0.000 | 0.000 |
0.000 0.000 | 0.000 |
0.000 0.000 | 0.000 |
0.031 0.011 | 0.036 |
0.000 0.000 | 0.014 |
0.829 0.824 | 0.833 |
0.140 0.134 | 0.145 |
| 2 spectra, LVLADGVSYACK | 0.000 | 0.000 | 0.000 | 0.000 | 0.099 | 0.000 | 0.841 | 0.060 | ||
| 2 spectra, GFGGIYGVGK | 0.000 | 0.000 | 0.000 | 0.000 | 0.064 | 0.085 | 0.784 | 0.067 | ||
| 4 spectra, DCGGAAAILGAFR | 0.000 | 0.000 | 0.000 | 0.000 | 0.000 | 0.000 | 0.785 | 0.215 | ||
| 11 spectra, AFPLFTHR | 0.000 | 0.000 | 0.000 | 0.000 | 0.028 | 0.044 | 0.789 | 0.139 | ||
| 2 spectra, TVEINNTDAEGR | 0.017 | 0.000 | 0.000 | 0.000 | 0.000 | 0.056 | 0.827 | 0.099 | ||
| 2 spectra, TTMPGMK | 0.000 | 0.000 | 0.000 | 0.000 | 0.128 | 0.000 | 0.823 | 0.049 | ||
| 2 spectra, ELGITPTIIR | 0.000 | 0.000 | 0.000 | 0.000 | 0.000 | 0.000 | 0.814 | 0.186 | ||
| 4 spectra, GIVYDTGGLSIK | 0.000 | 0.000 | 0.000 | 0.000 | 0.000 | 0.000 | 0.770 | 0.230 |
| Plot | Mito | Lyso or Perox | ER | Golgi | PM | Cytosol | Nucleus | ||||||
| Expt B |
3 peptides |
7 spectra |
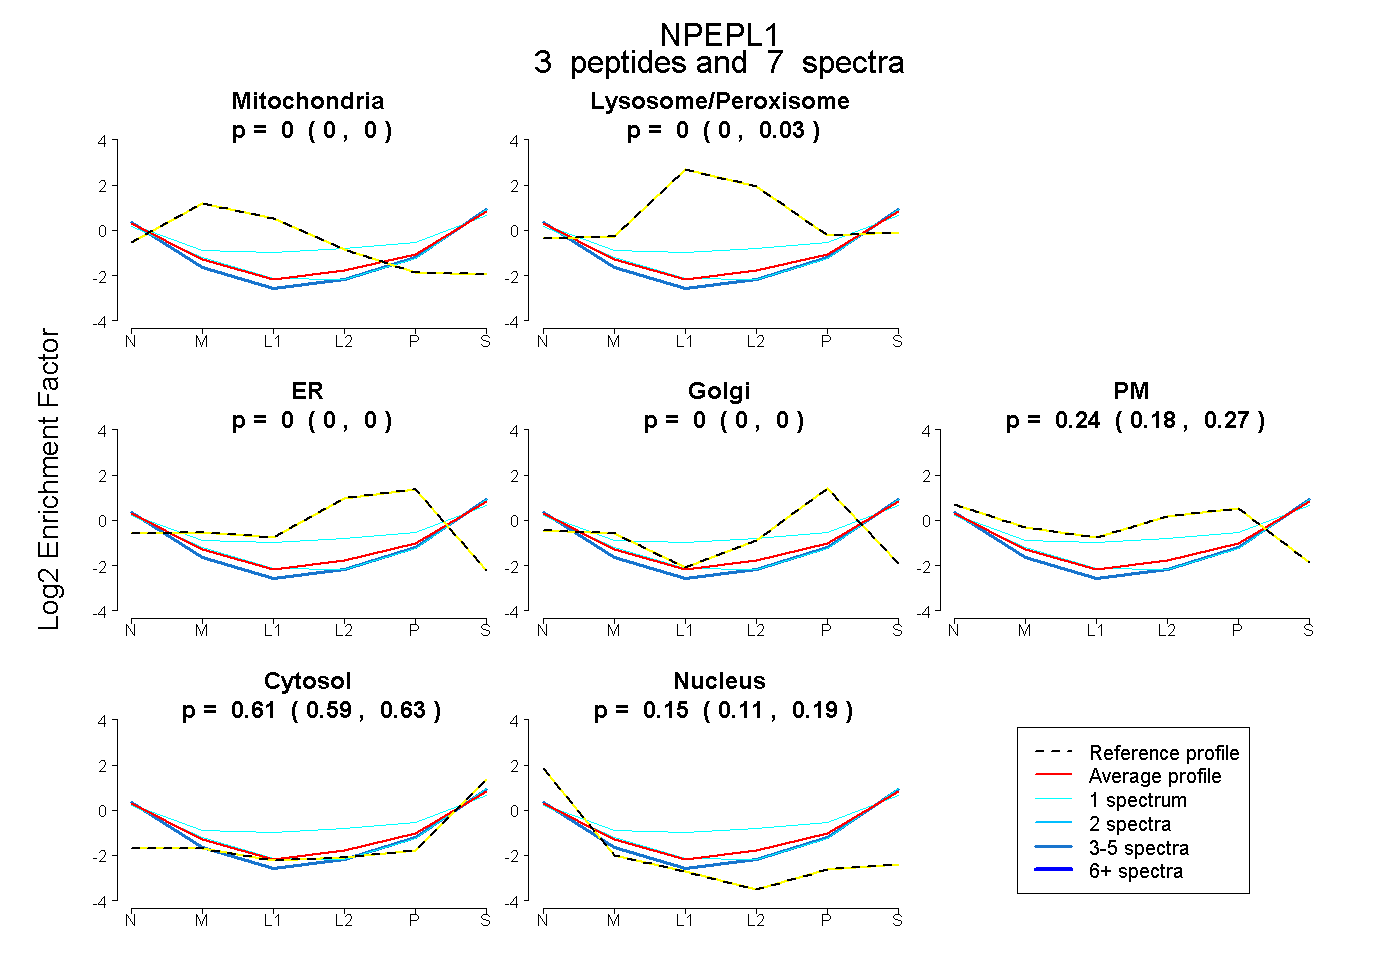 |
0.000 0.000 | 0.000 |
0.000 0.000 | 0.026 |
0.000 0.000 | 0.000 |
0.000 0.000 | 0.000 |
0.235 0.175 | 0.270 |
0.615 0.593 | 0.628 |
0.150 0.112 | 0.186 |
|||
| Plot | Lyso | Other | |||||||||||
| Expt C |
5 peptides |
16 spectra |
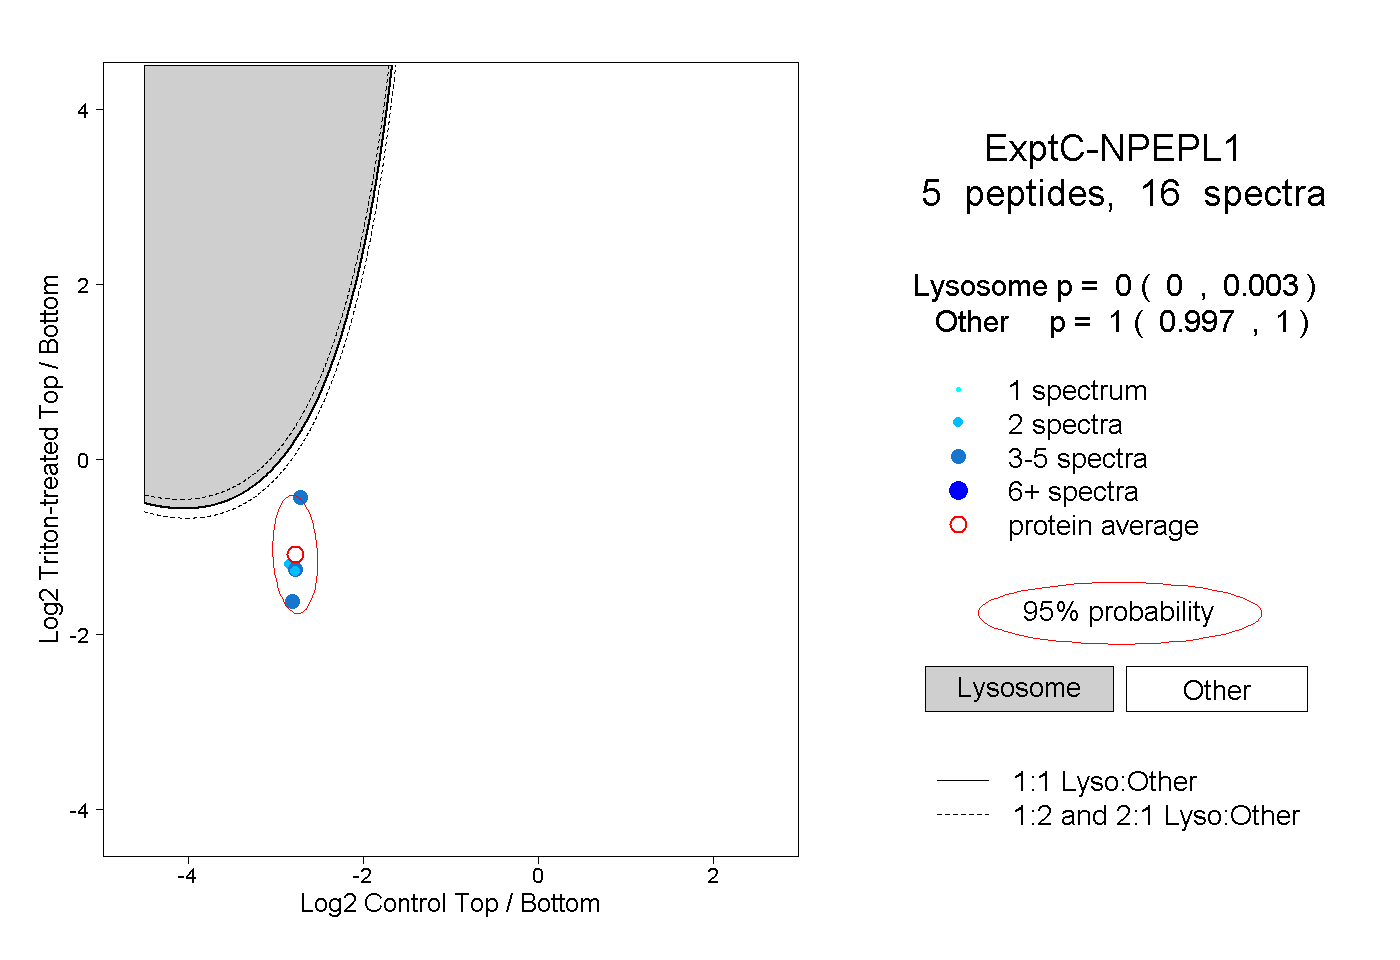 |
0.000 0.000 | 0.003 |
1.000 0.997 | 1.000 |