 31
31peptides
spectra
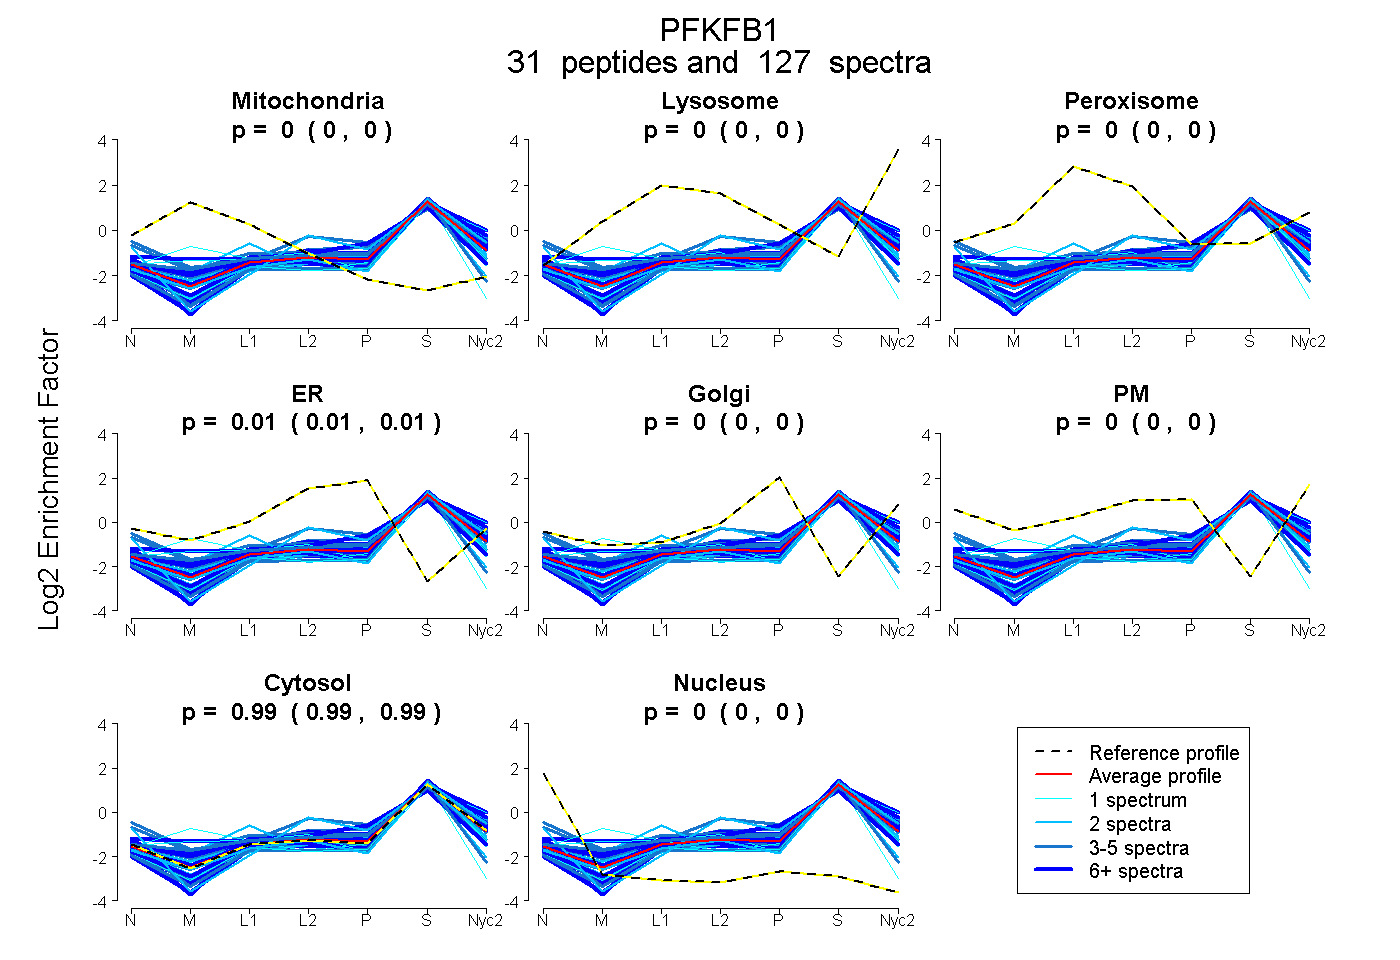
0.000 | 0.000
0.000 | 0.000
0.000 | 0.002
0.009 | 0.012
0.000 | 0.000
0.000 | 0.000
0.987 | 0.990
0.000 | 0.000
17peptides
spectra
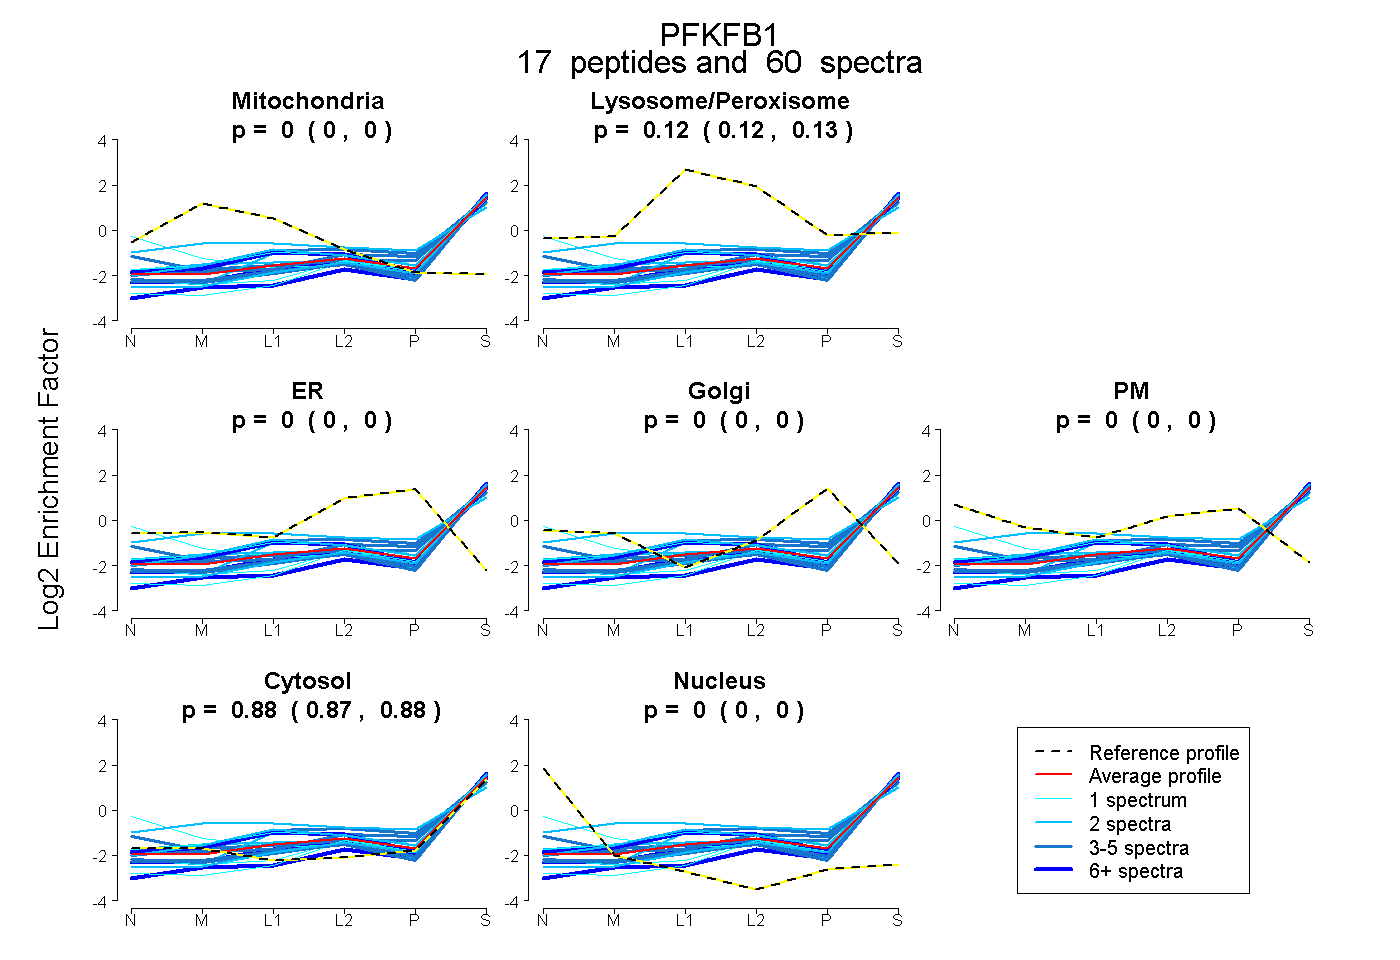
0.000 | 0.000
0.118 | 0.126
0.000 | 0.000
0.000 | 0.000
0.000 | 0.000
0.873 | 0.881
0.000 | 0.000
27peptides
spectra
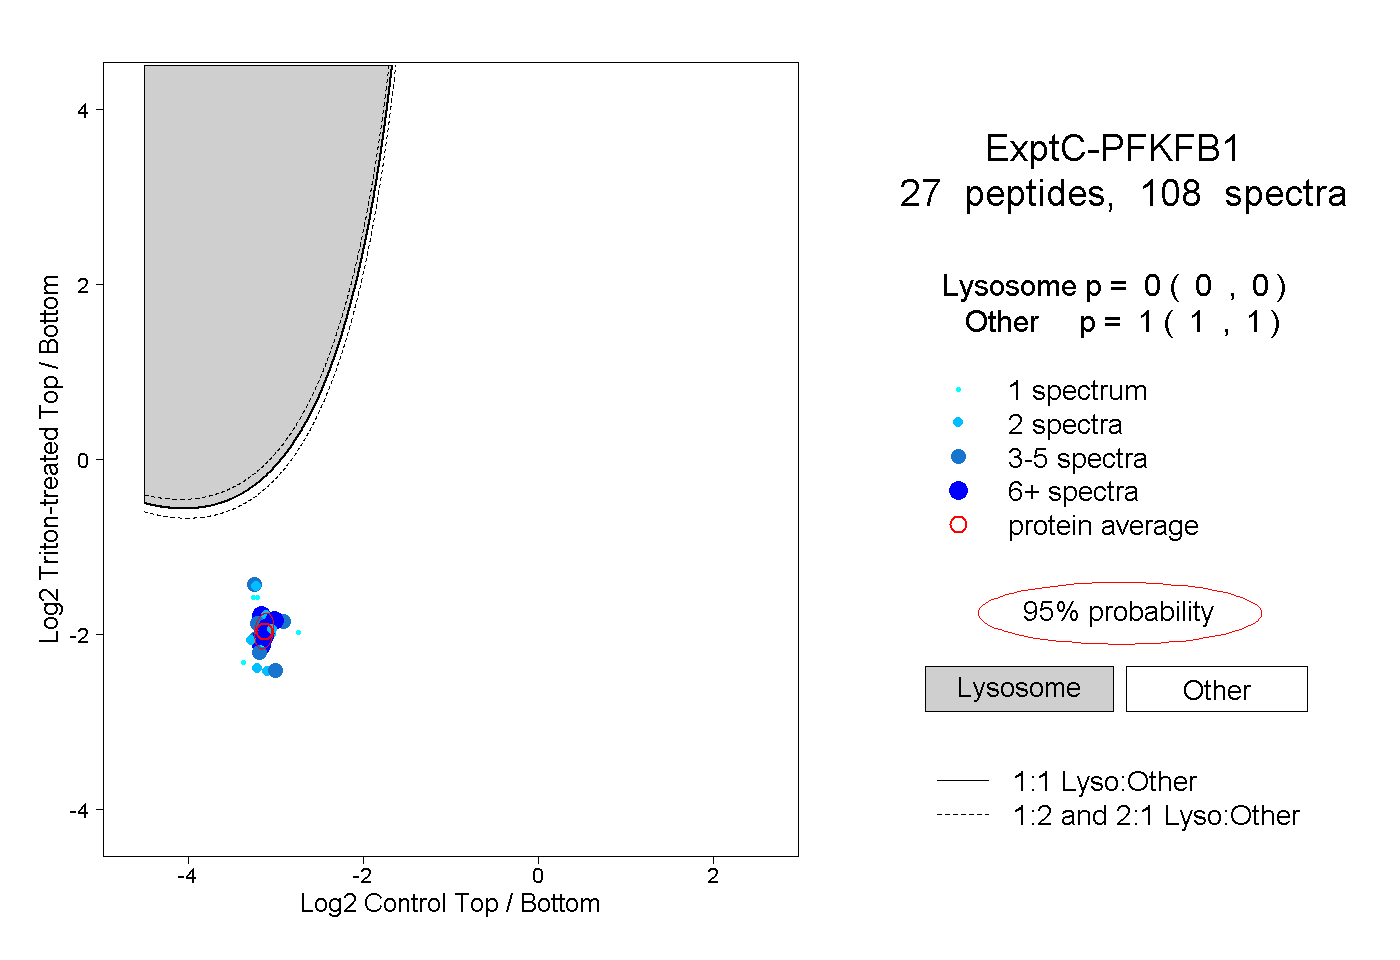
0.000 | 0.000
1.000 | 1.000
10peptides
spectra
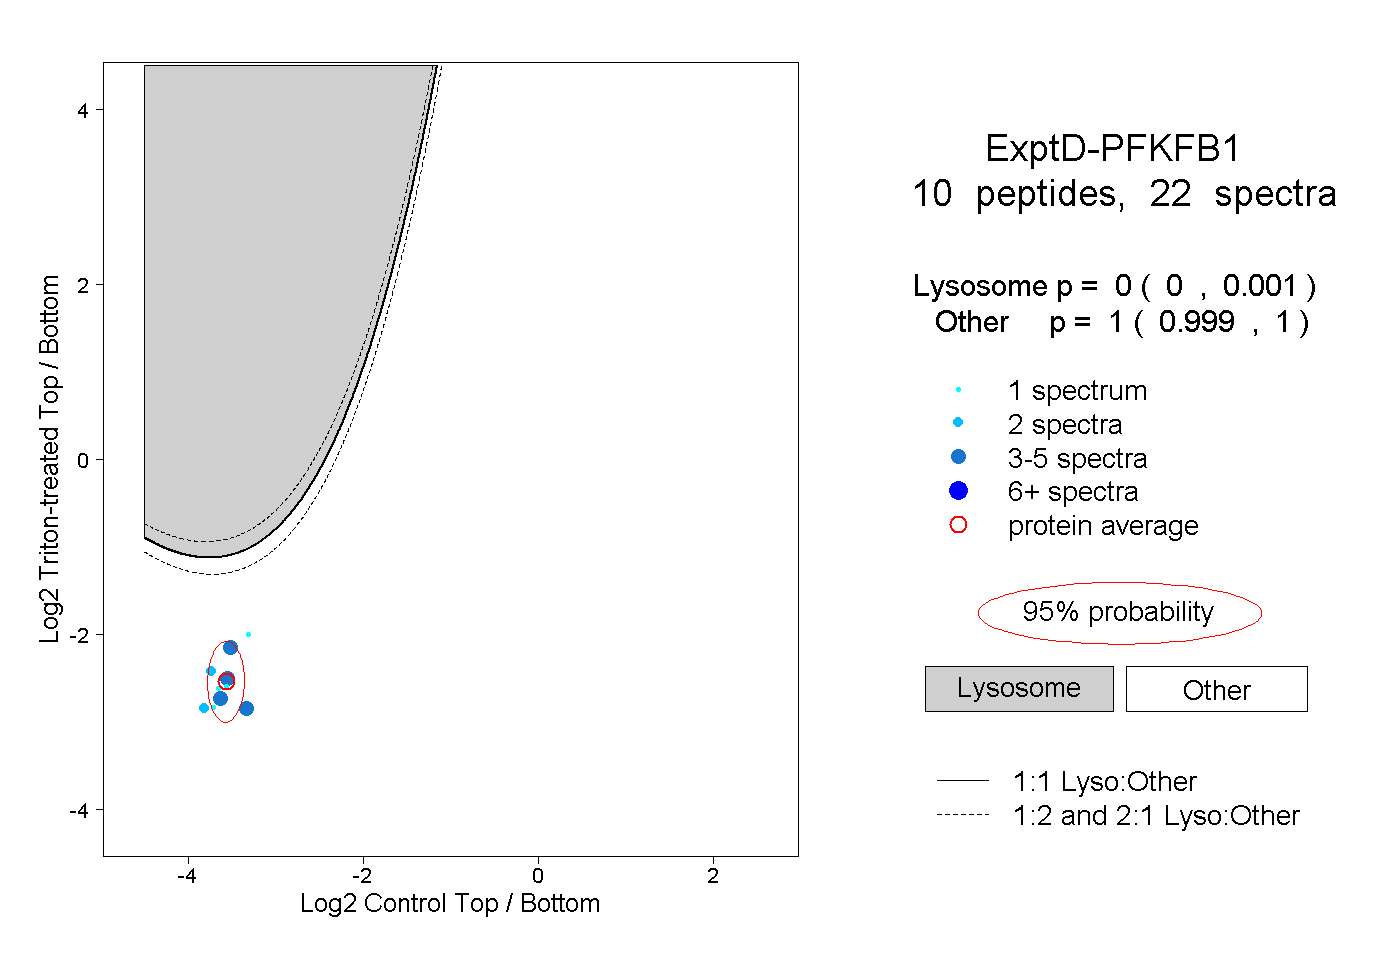
0.000 | 0.001
0.999 | 1.000