 7
7peptides
spectra
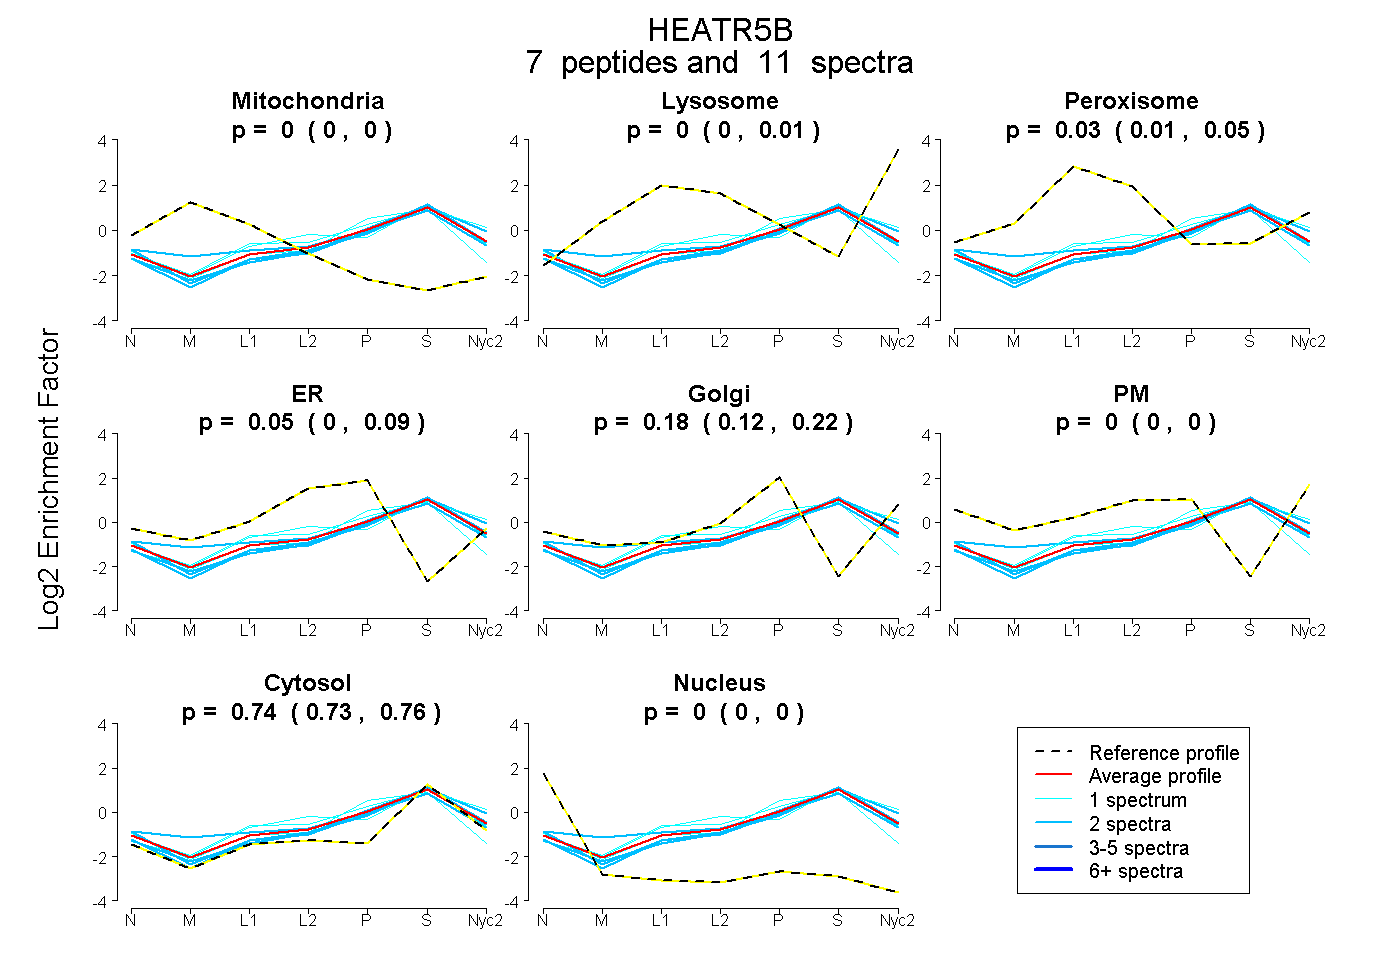
0.000 | 0.000
0.000 | 0.006
0.010 | 0.050
0.000 | 0.095
0.124 | 0.217
0.000 | 0.000
0.726 | 0.755
0.000 | 0.000
1peptide
spectrum
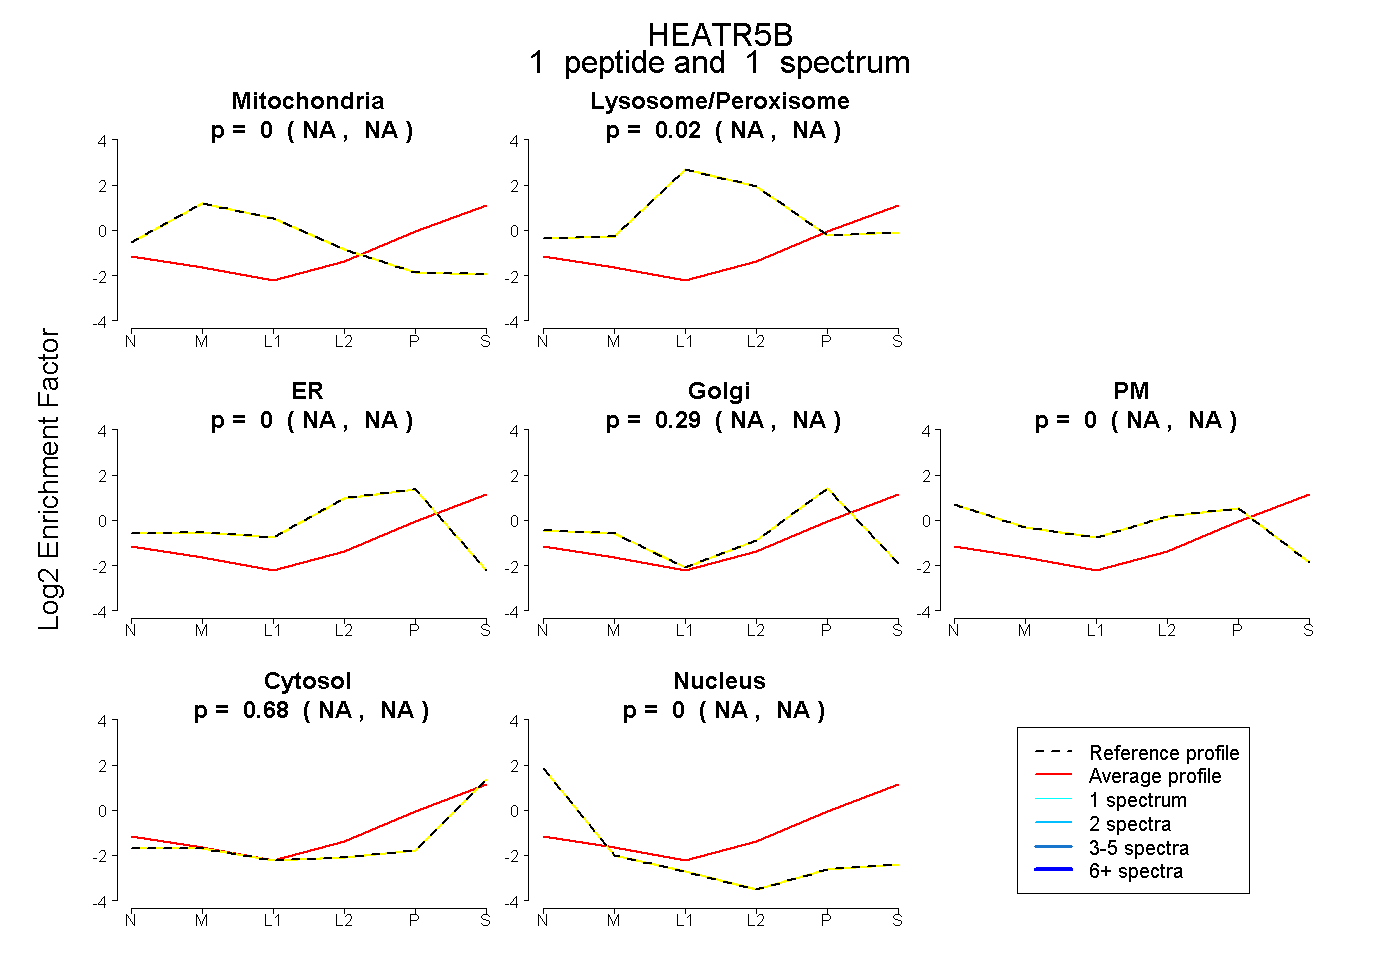
NA | NA
NA | NA
NA | NA
NA | NA
NA | NA
NA | NA
NA | NA
9peptides
spectra
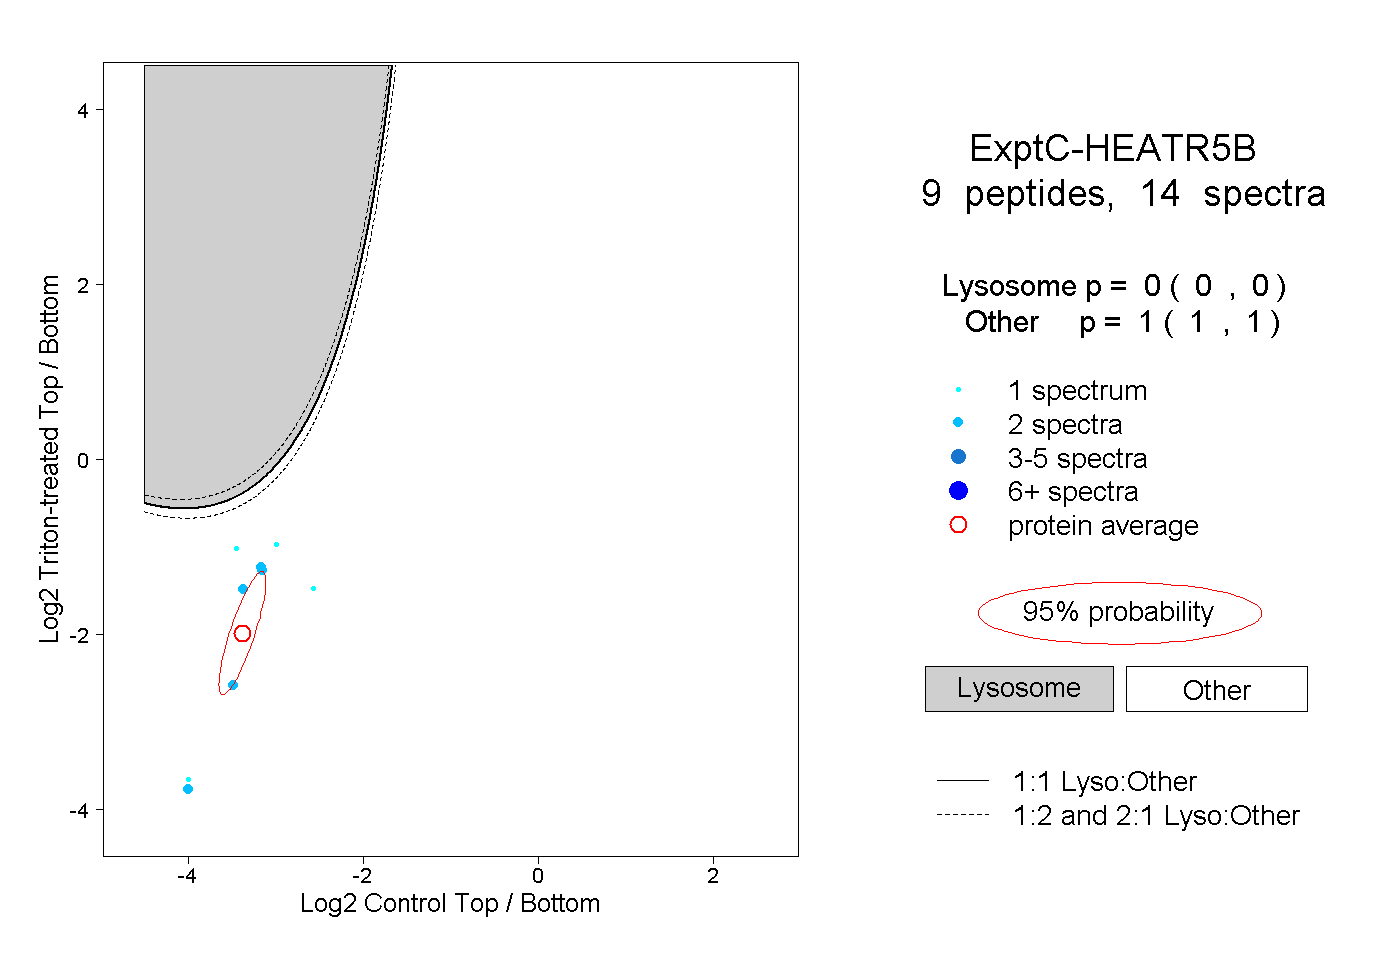
0.000 | 0.000
1.000 | 1.000