 11
11peptides
spectra
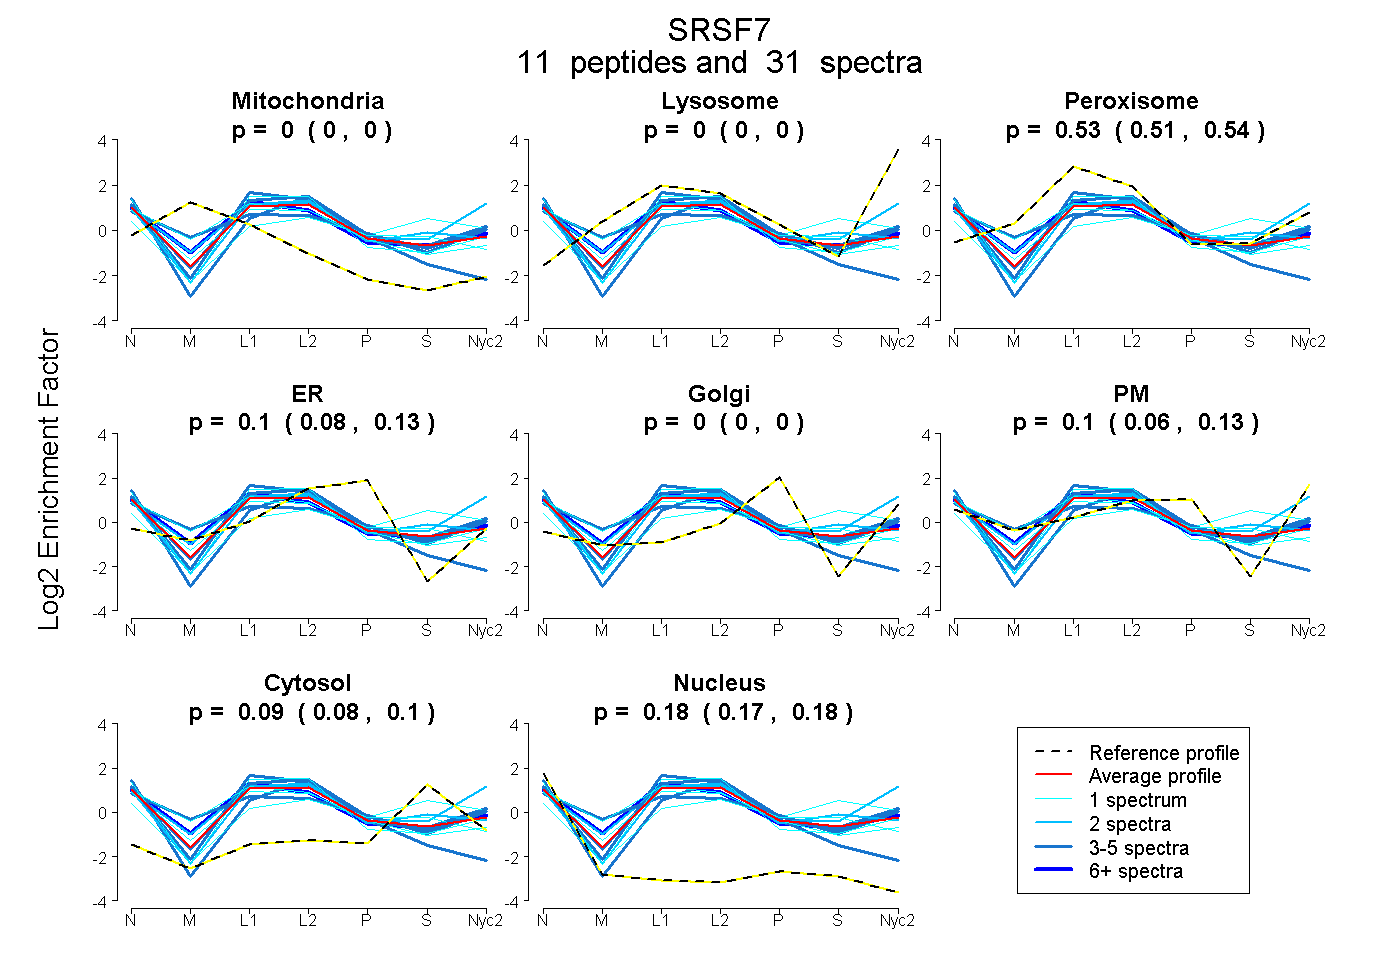
0.000 | 0.000
0.000 | 0.000
0.512 | 0.542
0.078 | 0.127
0.000 | 0.000
0.063 | 0.131
0.079 | 0.103
0.167 | 0.184
5peptides
spectra
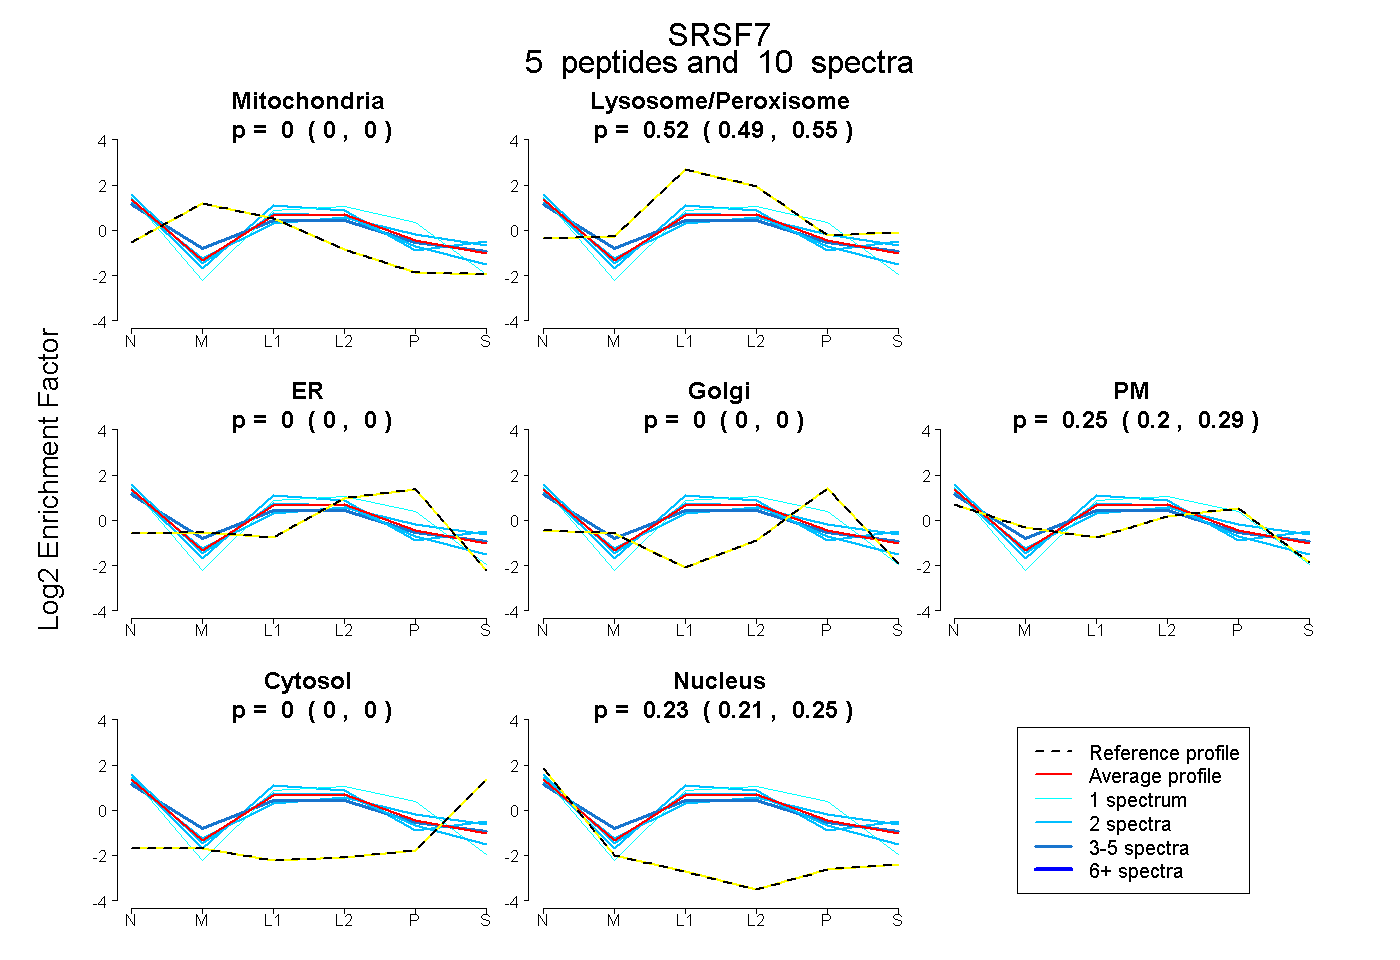
0.000 | 0.000
0.492 | 0.546
0.000 | 0.000
0.000 | 0.000
0.199 | 0.289
0.000 | 0.000
0.205 | 0.251
13peptides
spectra
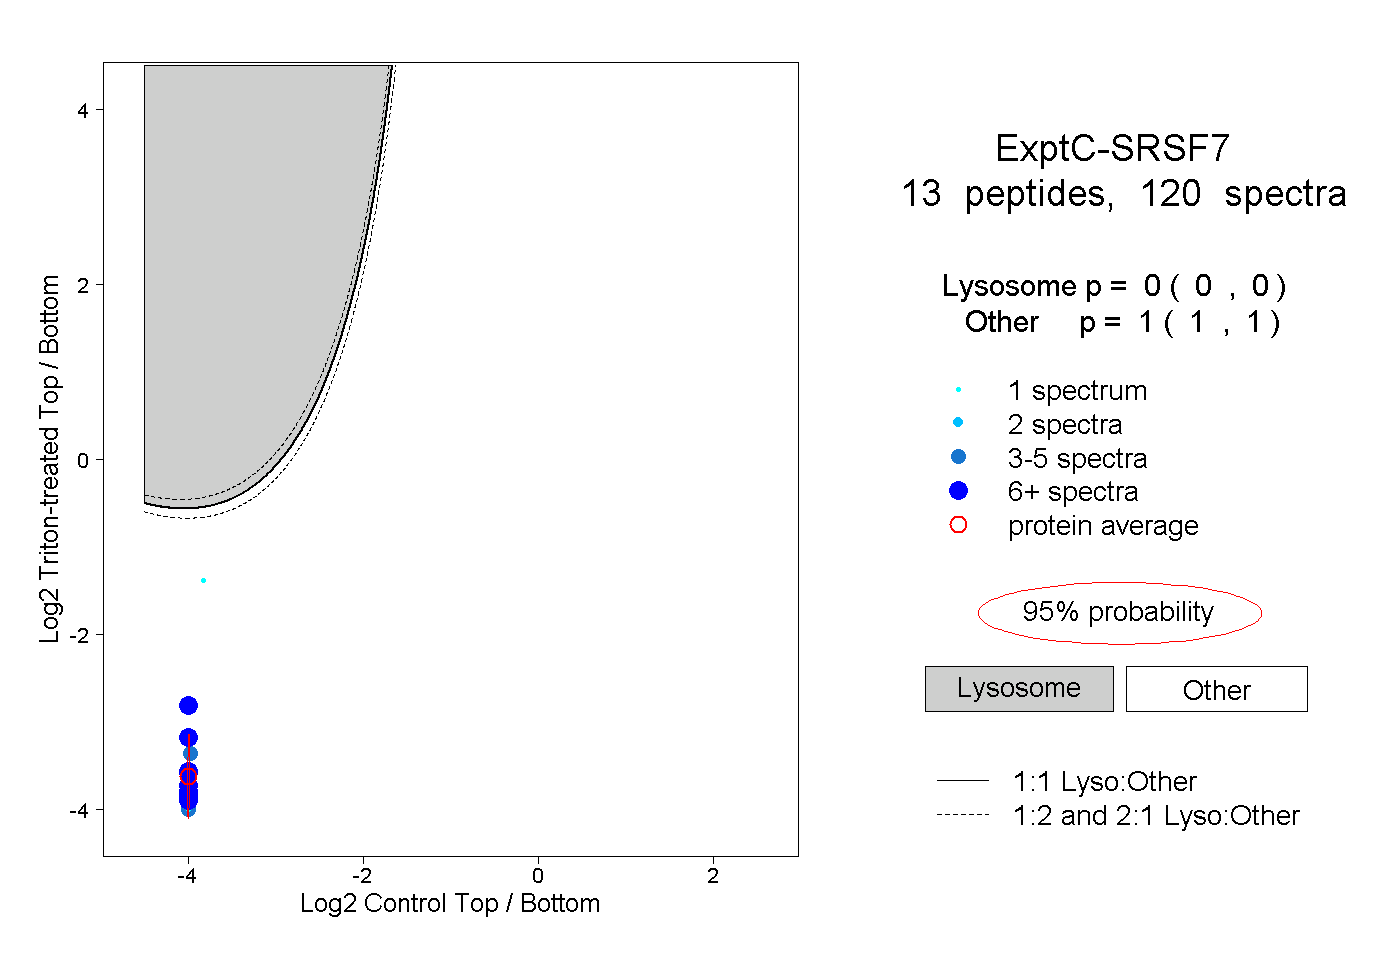
0.000 | 0.000
1.000 | 1.000
6peptides
spectra
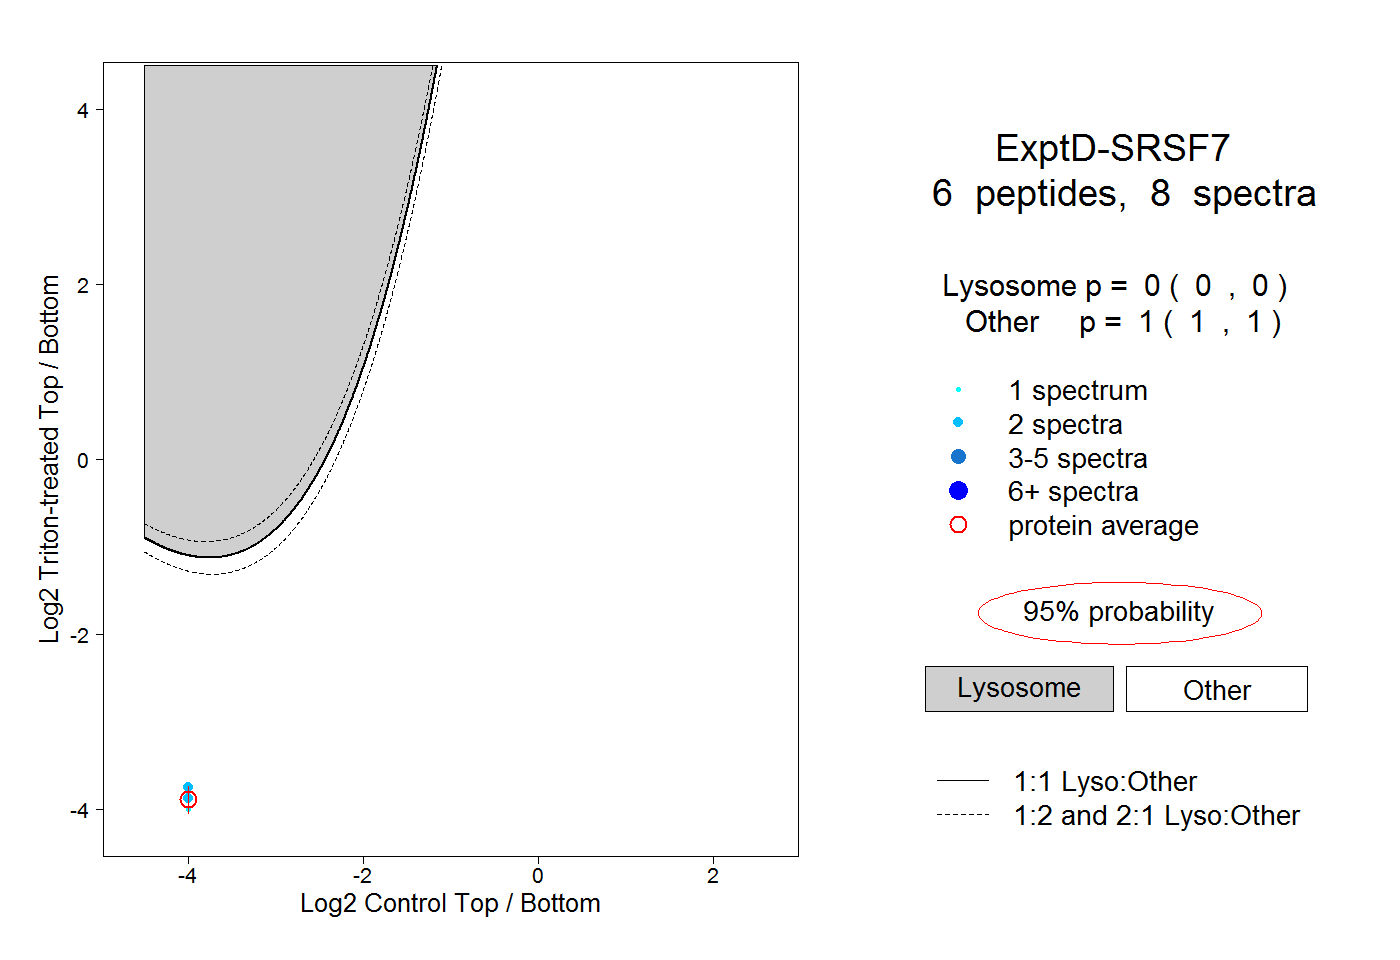
0.000 | 0.000
1.000 | 1.000