 11
11peptides
spectra
0.000 | 0.000
0.000 | 0.000
0.512 | 0.542
0.078 | 0.127
0.000 | 0.000
0.063 | 0.131
0.079 | 0.103
0.167 | 0.184
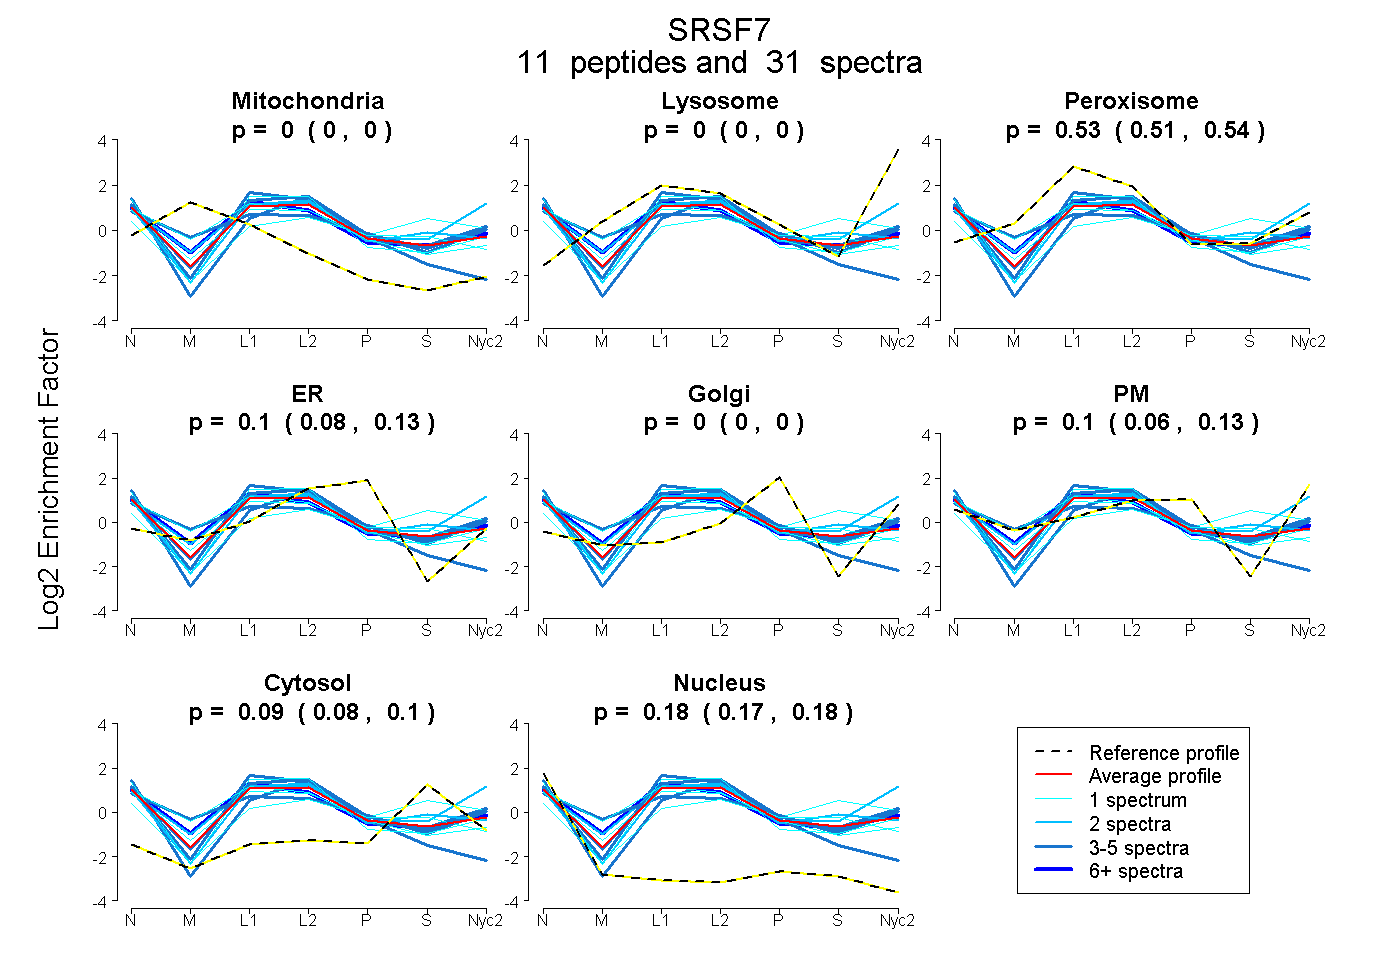
| Plot | Mito | Lyso | Perox | ER | Golgi | PM | Cytosol | Nucleus | |||||
| Expt A |
11 peptides |
31 spectra |
|
0.000 0.000 | 0.000 |
0.000 0.000 | 0.000 |
0.529 0.512 | 0.542 |
0.105 0.078 | 0.127 |
0.000 0.000 | 0.000 |
0.099 0.063 | 0.131 |
0.091 0.079 | 0.103 |
0.176 0.167 | 0.184 |
| 1 spectrum, RPFDPNDR | 0.000 | 0.000 | 0.231 | 0.016 | 0.000 | 0.240 | 0.513 | 0.000 | ||
| 1 spectrum, VYVGNLGTGAGK | 0.000 | 0.000 | 0.637 | 0.084 | 0.000 | 0.036 | 0.000 | 0.243 | ||
| 1 spectrum, VICGSR | 0.000 | 0.000 | 0.520 | 0.156 | 0.000 | 0.000 | 0.146 | 0.178 | ||
| 8 spectra, AFSYYGPLR | 0.000 | 0.000 | 0.624 | 0.000 | 0.000 | 0.142 | 0.037 | 0.198 | ||
| 2 spectra, FDRPPAR | 0.000 | 0.000 | 0.459 | 0.000 | 0.000 | 0.369 | 0.159 | 0.012 | ||
| 3 spectra, DAEDAVR | 0.000 | 0.000 | 0.603 | 0.008 | 0.000 | 0.166 | 0.068 | 0.155 | ||
| 4 spectra, TVWIAR | 0.000 | 0.000 | 0.527 | 0.096 | 0.000 | 0.187 | 0.055 | 0.134 | ||
| 4 spectra, CYECGEK | 0.000 | 0.000 | 0.313 | 0.348 | 0.000 | 0.000 | 0.000 | 0.338 | ||
| 4 spectra, GHYAYDCHR | 0.000 | 0.000 | 0.456 | 0.000 | 0.000 | 0.329 | 0.044 | 0.170 | ||
| 1 spectrum, YGGETK | 0.000 | 0.000 | 0.622 | 0.143 | 0.000 | 0.008 | 0.000 | 0.226 | ||
| 2 spectra, VELSTGMPR | 0.000 | 0.000 | 0.526 | 0.119 | 0.000 | 0.000 | 0.220 | 0.135 |
| Plot | Mito | Lyso or Perox | ER | Golgi | PM | Cytosol | Nucleus | ||||||
| Expt B |
5 peptides |
10 spectra |
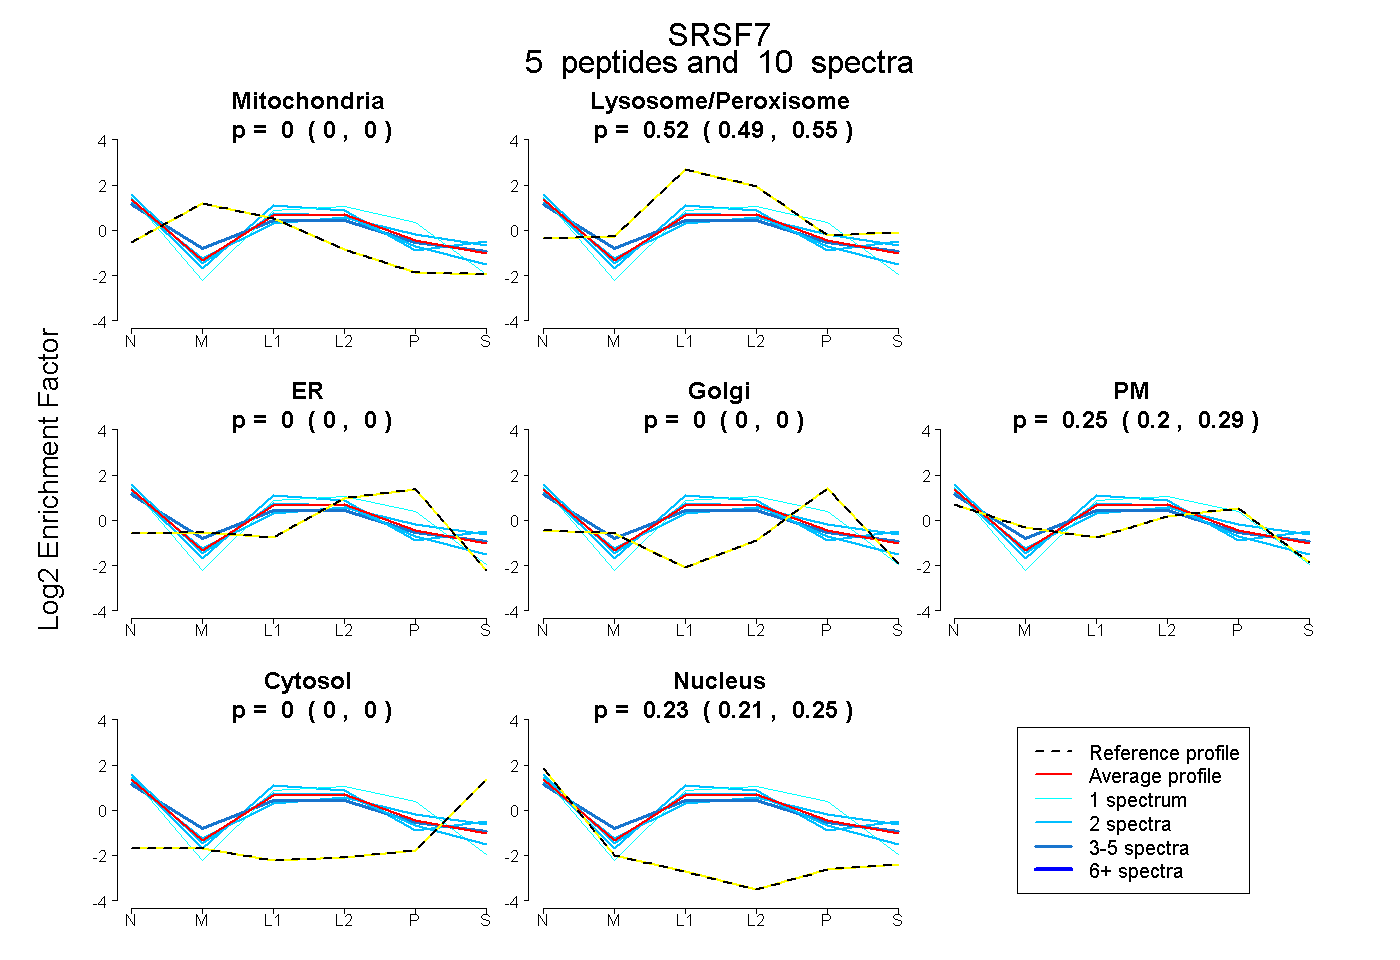 |
0.000 0.000 | 0.000 |
0.522 0.492 | 0.546 |
0.000 0.000 | 0.000 |
0.000 0.000 | 0.000 |
0.248 0.199 | 0.289 |
0.000 0.000 | 0.000 |
0.230 0.205 | 0.251 |
|||
| Plot | Lyso | Other | |||||||||||
| Expt C |
13 peptides |
120 spectra |
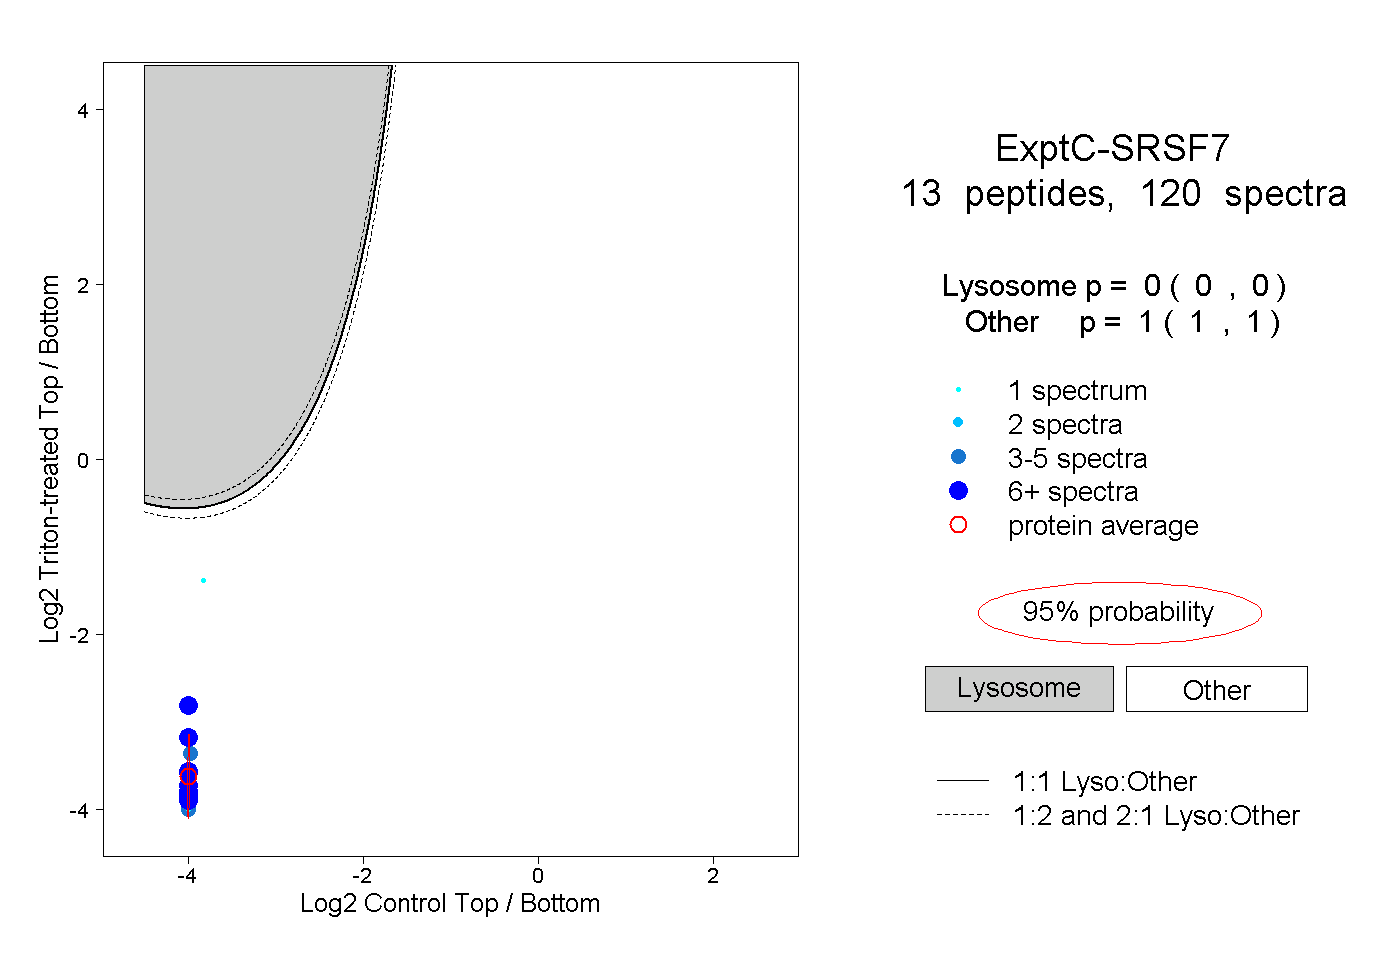 |
0.000 0.000 | 0.000 |
1.000 1.000 | 1.000 |
||||||||
| Plot | Lyso | Other | |||||||||||
| Expt D |
6 peptides |
8 spectra |
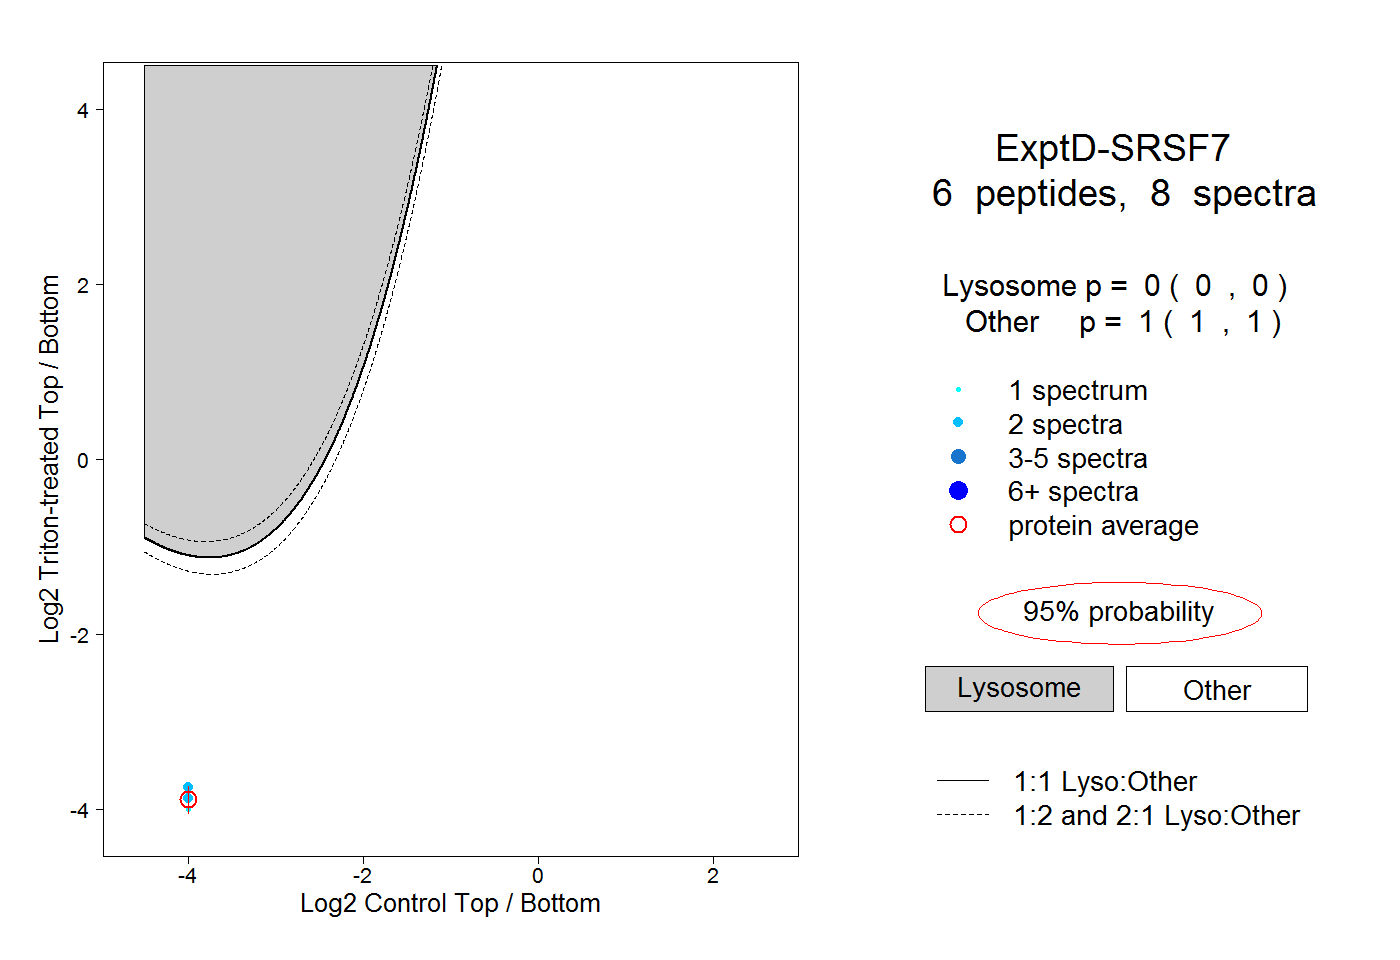 |
0.000 0.000 | 0.000 |
1.000 1.000 | 1.000 |