 8
8peptides
spectra
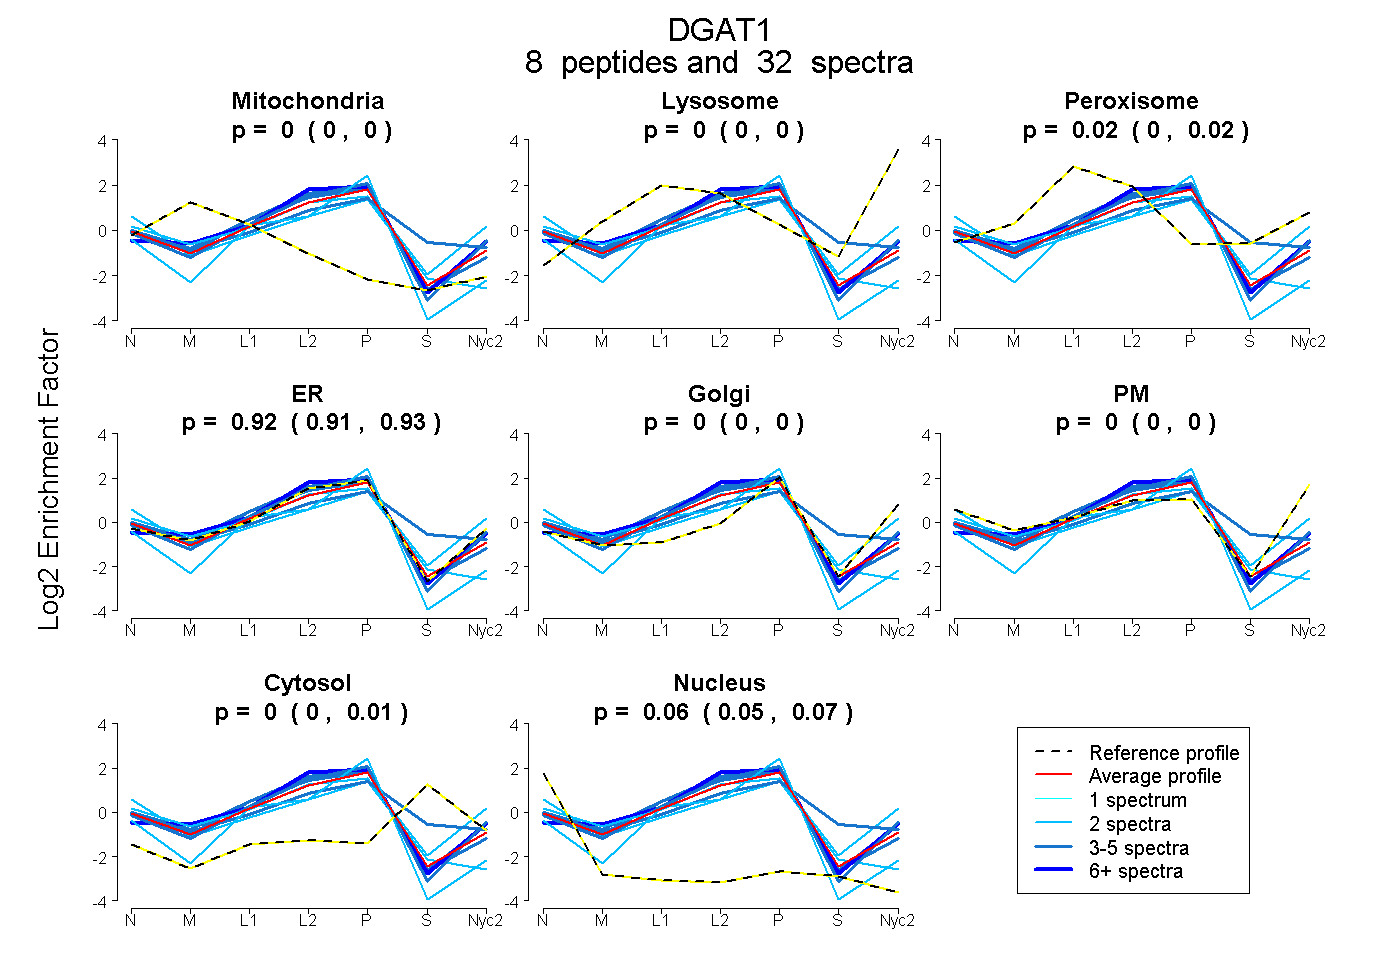
0.000 | 0.000
0.000 | 0.000
0.001 | 0.025
0.906 | 0.935
0.000 | 0.000
0.000 | 0.000
0.000 | 0.014
0.052 | 0.068
1peptide
spectra
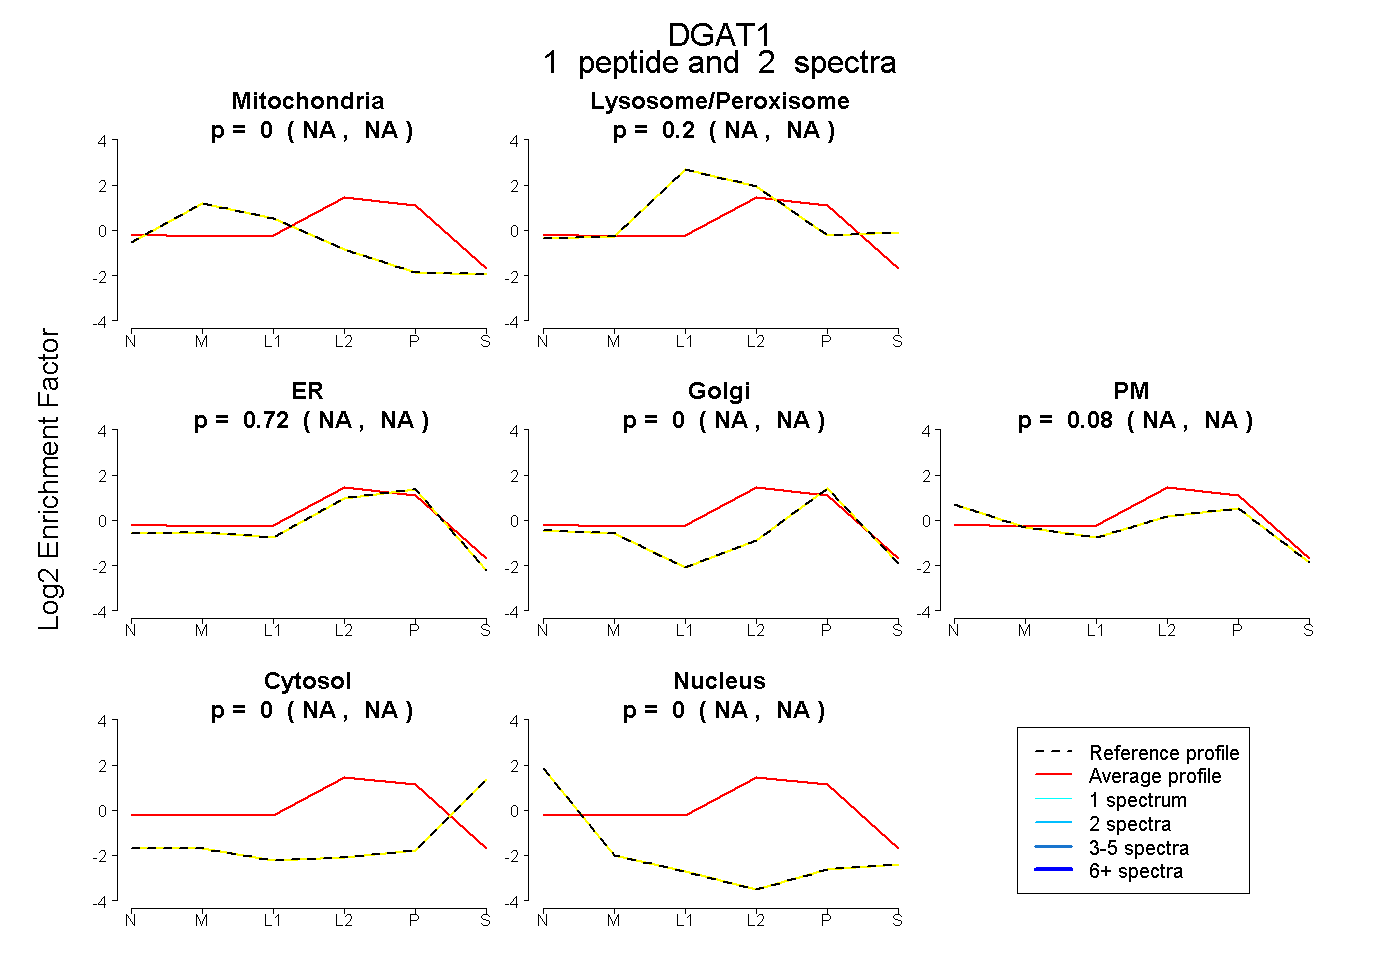
NA | NA
NA | NA
NA | NA
NA | NA
NA | NA
NA | NA
NA | NA
4peptides
spectra
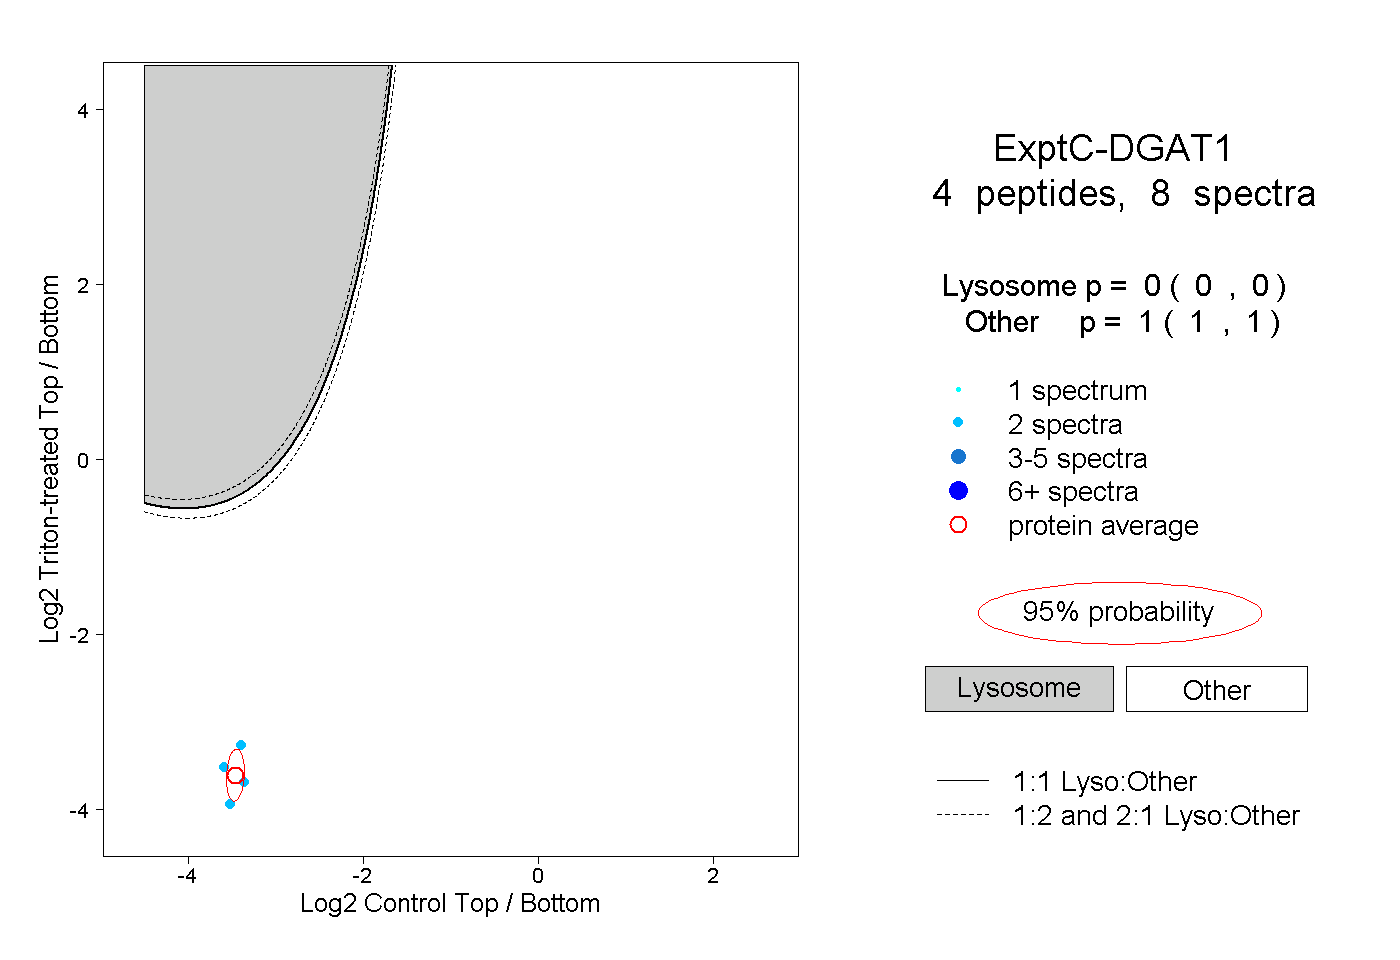
0.000 | 0.000
1.000 | 1.000
1peptide
spectrum
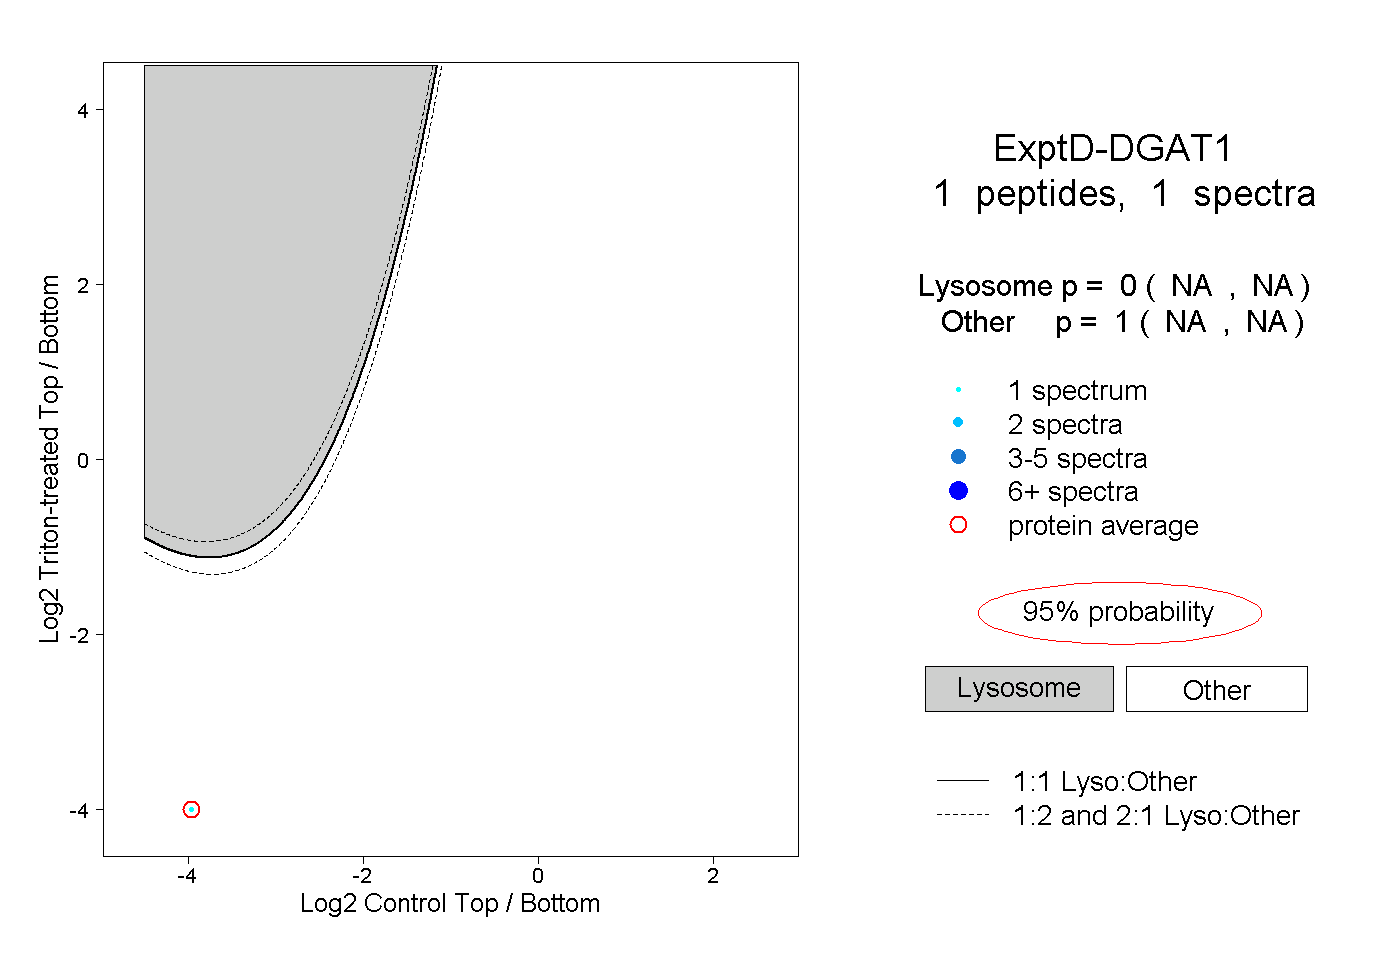
NA | NA
NA | NA