 8
8peptides
spectra
0.000 | 0.000
0.000 | 0.000
0.001 | 0.025
0.906 | 0.935
0.000 | 0.000
0.000 | 0.000
0.000 | 0.014
0.052 | 0.068
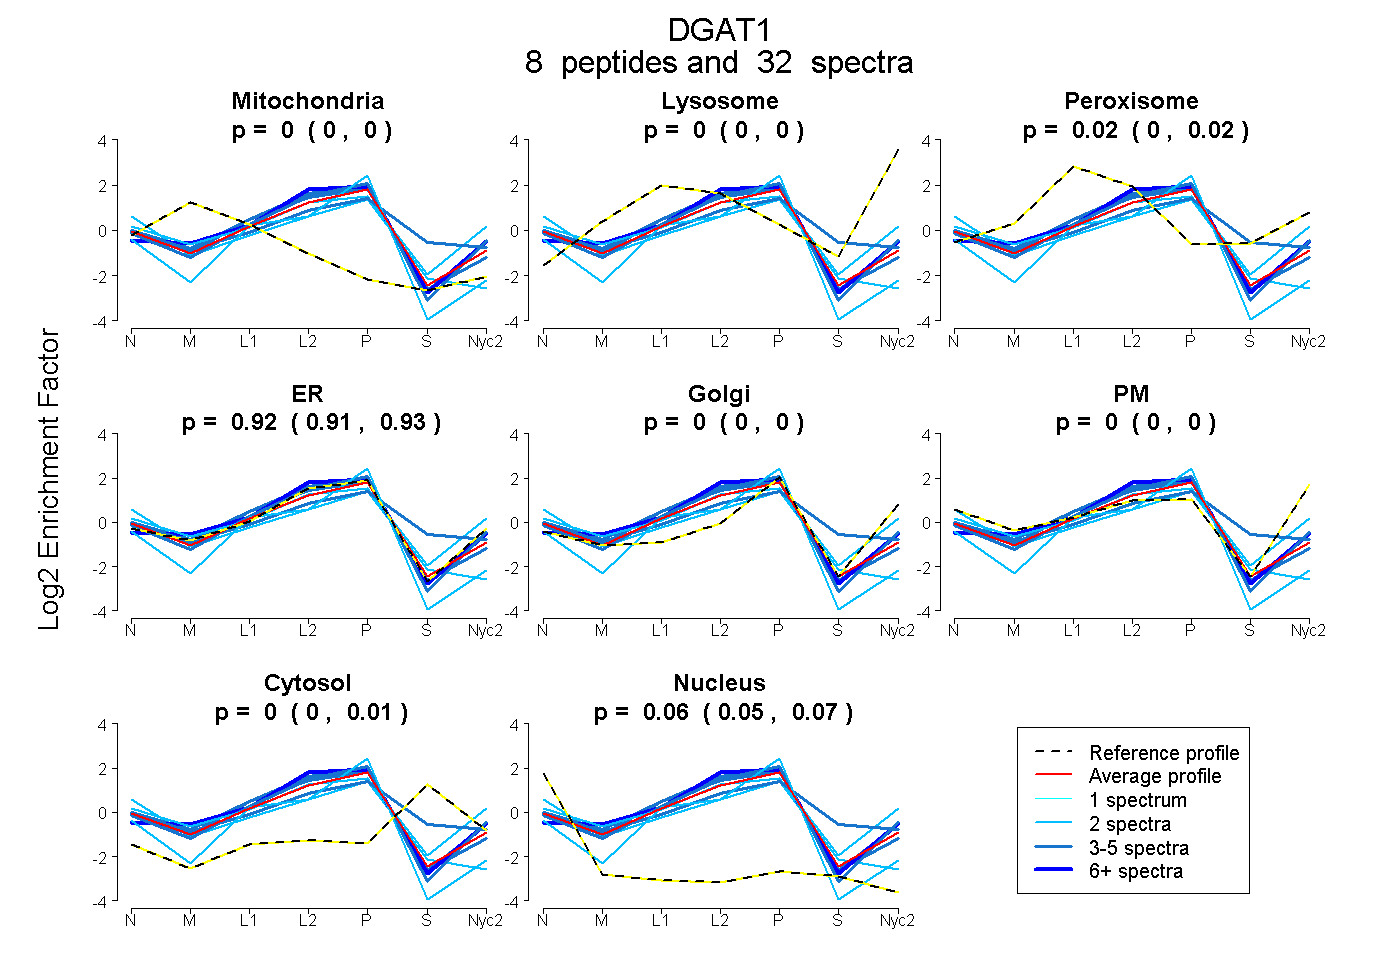
| Plot | Mito | Lyso | Perox | ER | Golgi | PM | Cytosol | Nucleus | |||||
| Expt A |
8 peptides |
32 spectra |
|
0.000 0.000 | 0.000 |
0.000 0.000 | 0.000 |
0.017 0.001 | 0.025 |
0.921 0.906 | 0.935 |
0.000 0.000 | 0.000 |
0.000 0.000 | 0.000 |
0.000 0.000 | 0.014 |
0.063 0.052 | 0.068 |
| 4 spectra, QTSVGDGHWELR | 0.000 | 0.000 | 0.089 | 0.634 | 0.000 | 0.000 | 0.278 | 0.000 | ||
| 5 spectra, DMDYSR | 0.000 | 0.000 | 0.029 | 0.971 | 0.000 | 0.000 | 0.000 | 0.000 | ||
| 2 spectra, AVSAGK | 0.009 | 0.000 | 0.000 | 0.748 | 0.000 | 0.000 | 0.000 | 0.243 | ||
| 2 spectra, LQDSLFSSDSGFSNYR | 0.000 | 0.000 | 0.052 | 0.603 | 0.000 | 0.278 | 0.067 | 0.000 | ||
| 4 spectra, DVNLWCR | 0.056 | 0.000 | 0.000 | 0.927 | 0.000 | 0.000 | 0.000 | 0.017 | ||
| 10 spectra, HFYKPMLR | 0.000 | 0.000 | 0.016 | 0.984 | 0.000 | 0.000 | 0.000 | 0.000 | ||
| 3 spectra, LFLENLIK | 0.000 | 0.000 | 0.000 | 0.990 | 0.000 | 0.000 | 0.000 | 0.010 | ||
| 2 spectra, VSIQGGSGPMVDEEEVR | 0.000 | 0.000 | 0.000 | 0.846 | 0.000 | 0.000 | 0.000 | 0.154 |
| Plot | Mito | Lyso or Perox | ER | Golgi | PM | Cytosol | Nucleus | ||||||
| Expt B |
1 peptide |
2 spectra |
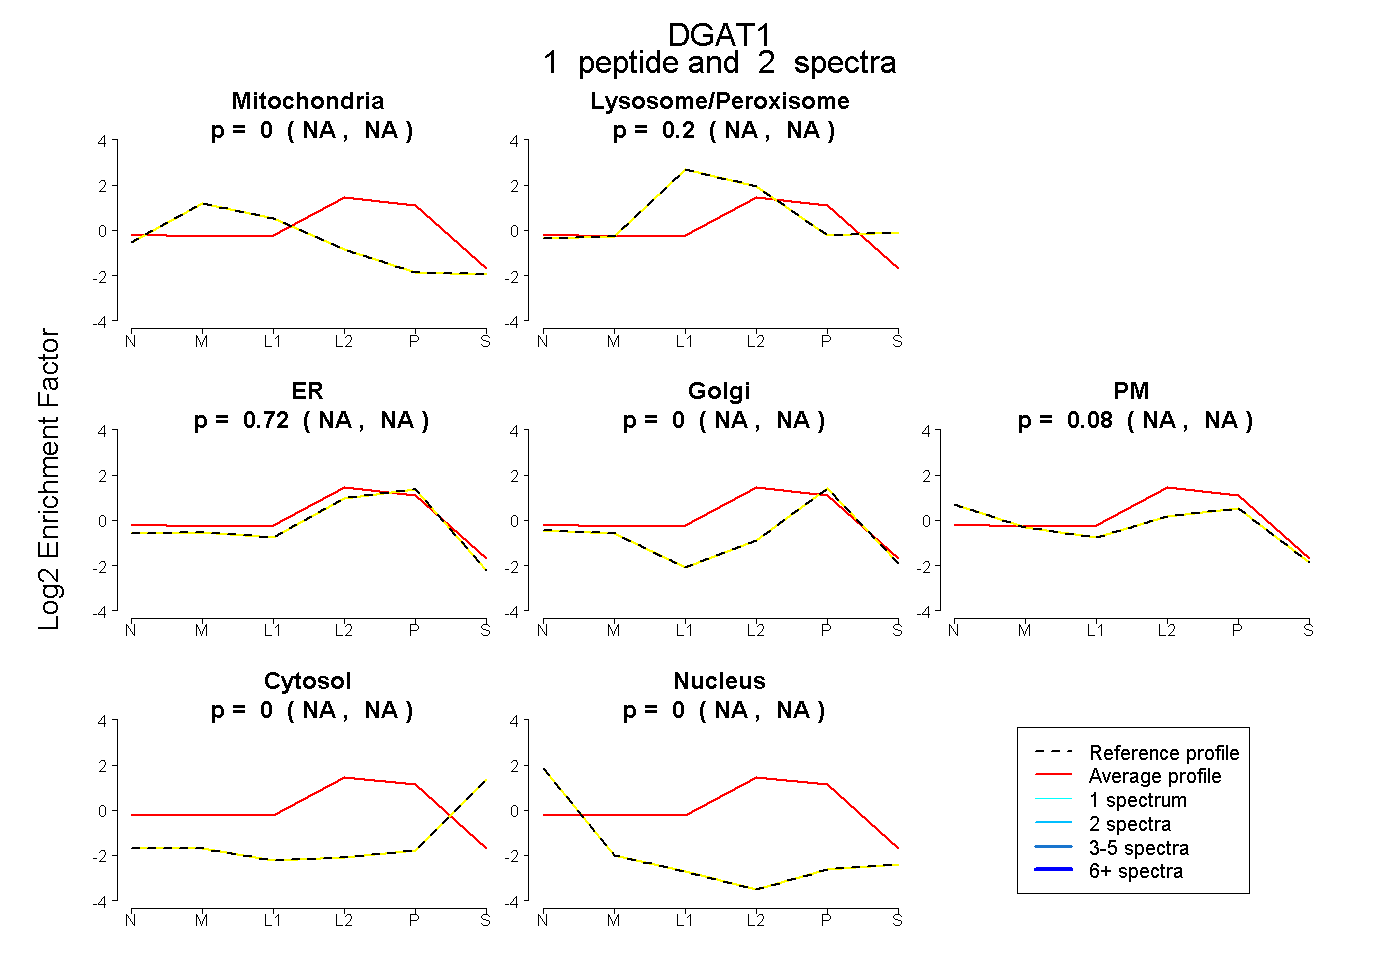 |
0.000 NA | NA |
0.195 NA | NA |
0.725 NA | NA |
0.000 NA | NA |
0.080 NA | NA |
0.000 NA | NA |
0.000 NA | NA |
|||
| Plot | Lyso | Other | |||||||||||
| Expt C |
4 peptides |
8 spectra |
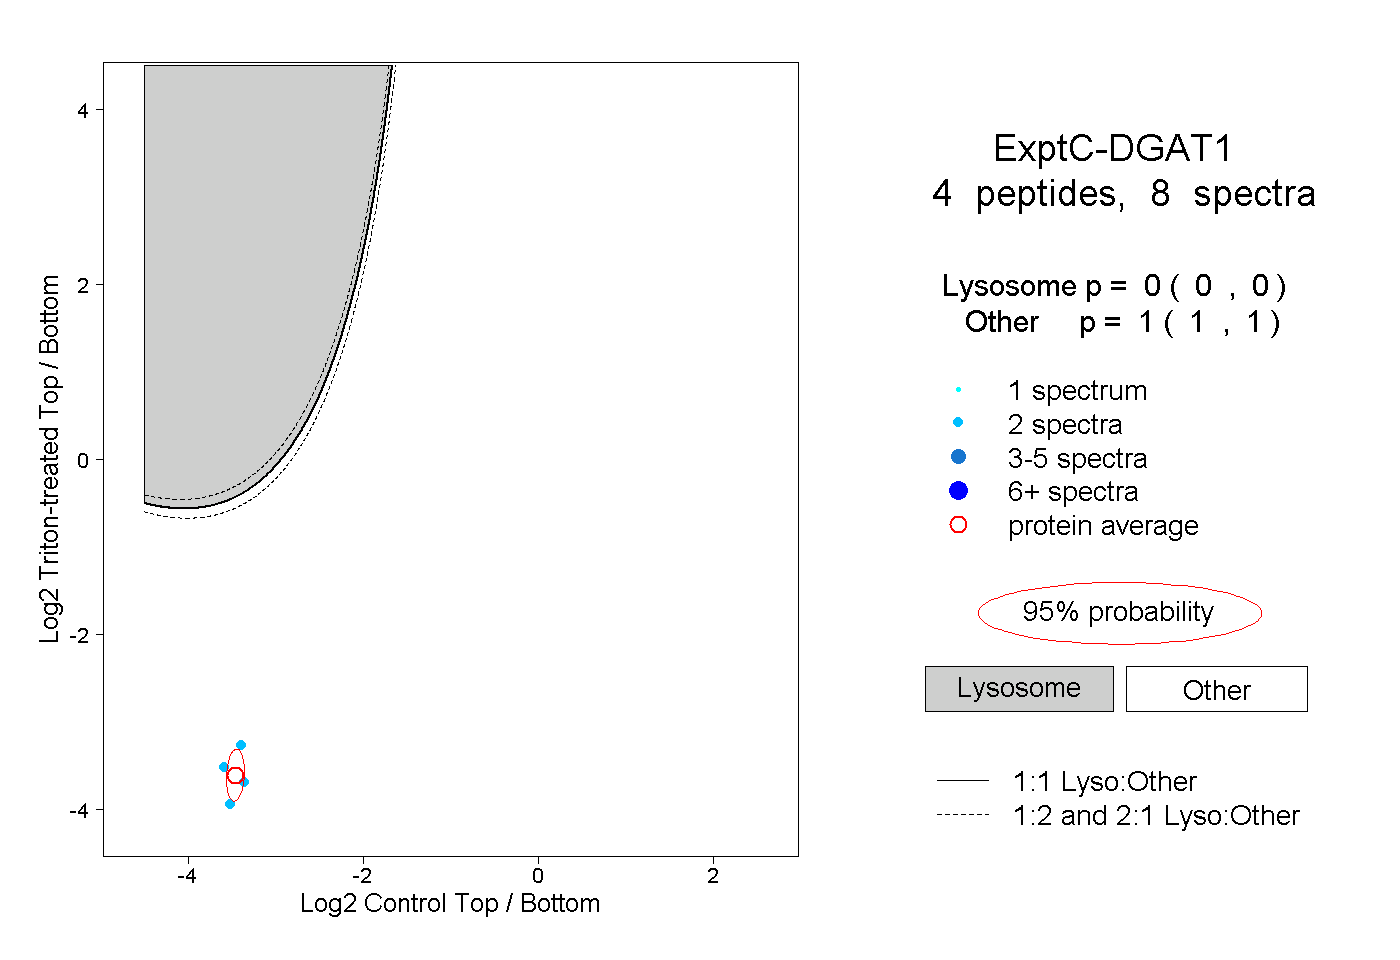 |
0.000 0.000 | 0.000 |
1.000 1.000 | 1.000 |
||||||||
| Plot | Lyso | Other | |||||||||||
| Expt D |
1 peptide |
1 spectrum |
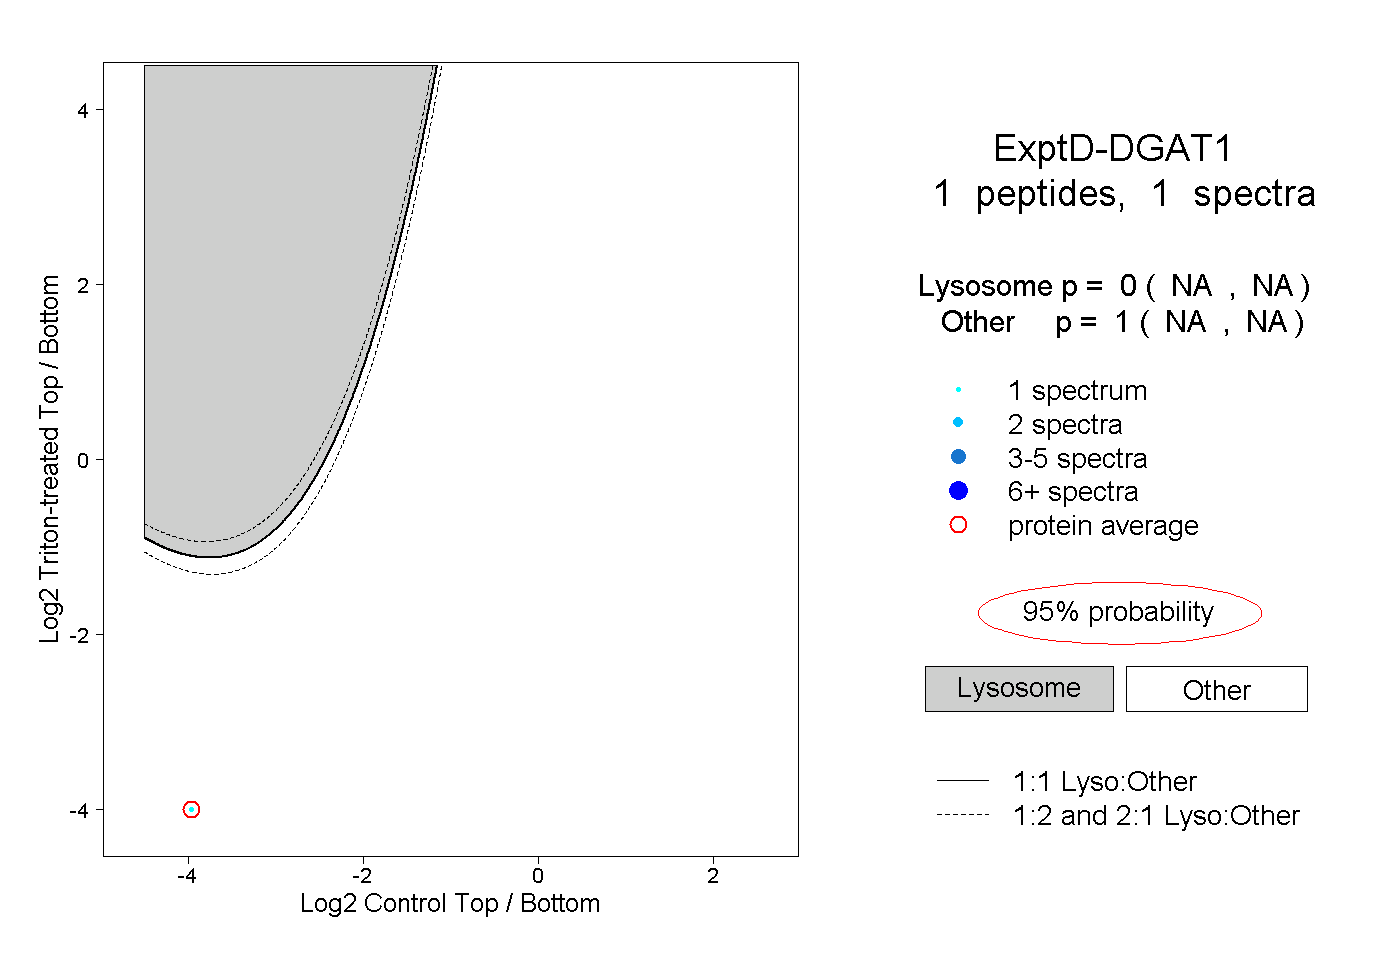 |
0.000 NA | NA |
1.000 NA | NA |