 19
19peptides
spectra
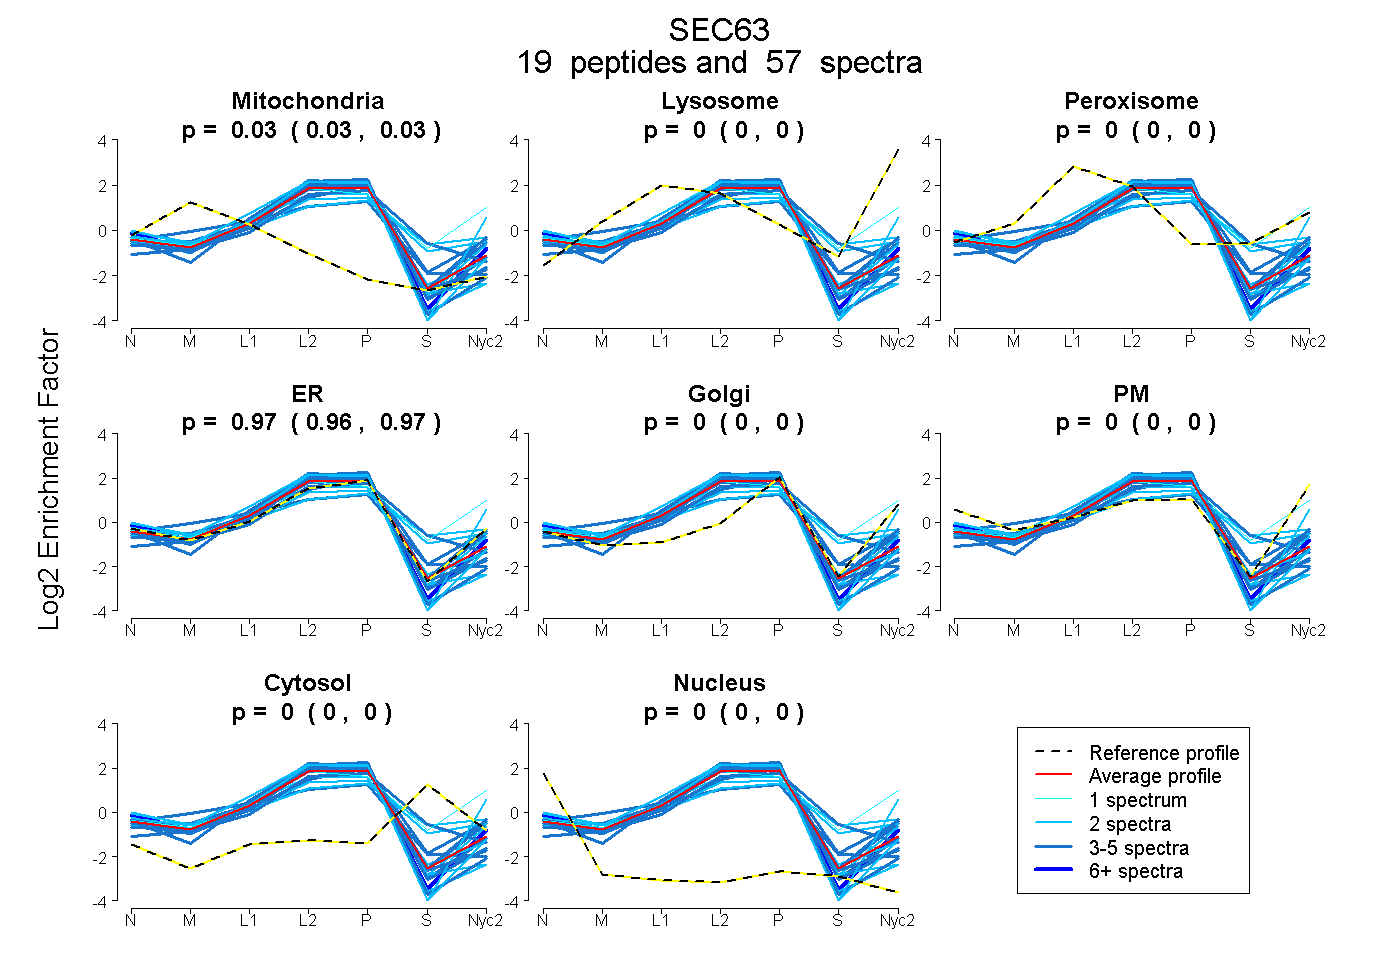
0.026 | 0.034
0.000 | 0.000
0.000 | 0.003
0.964 | 0.973
0.000 | 0.000
0.000 | 0.000
0.000 | 0.000
0.000 | 0.000
14peptides
spectra
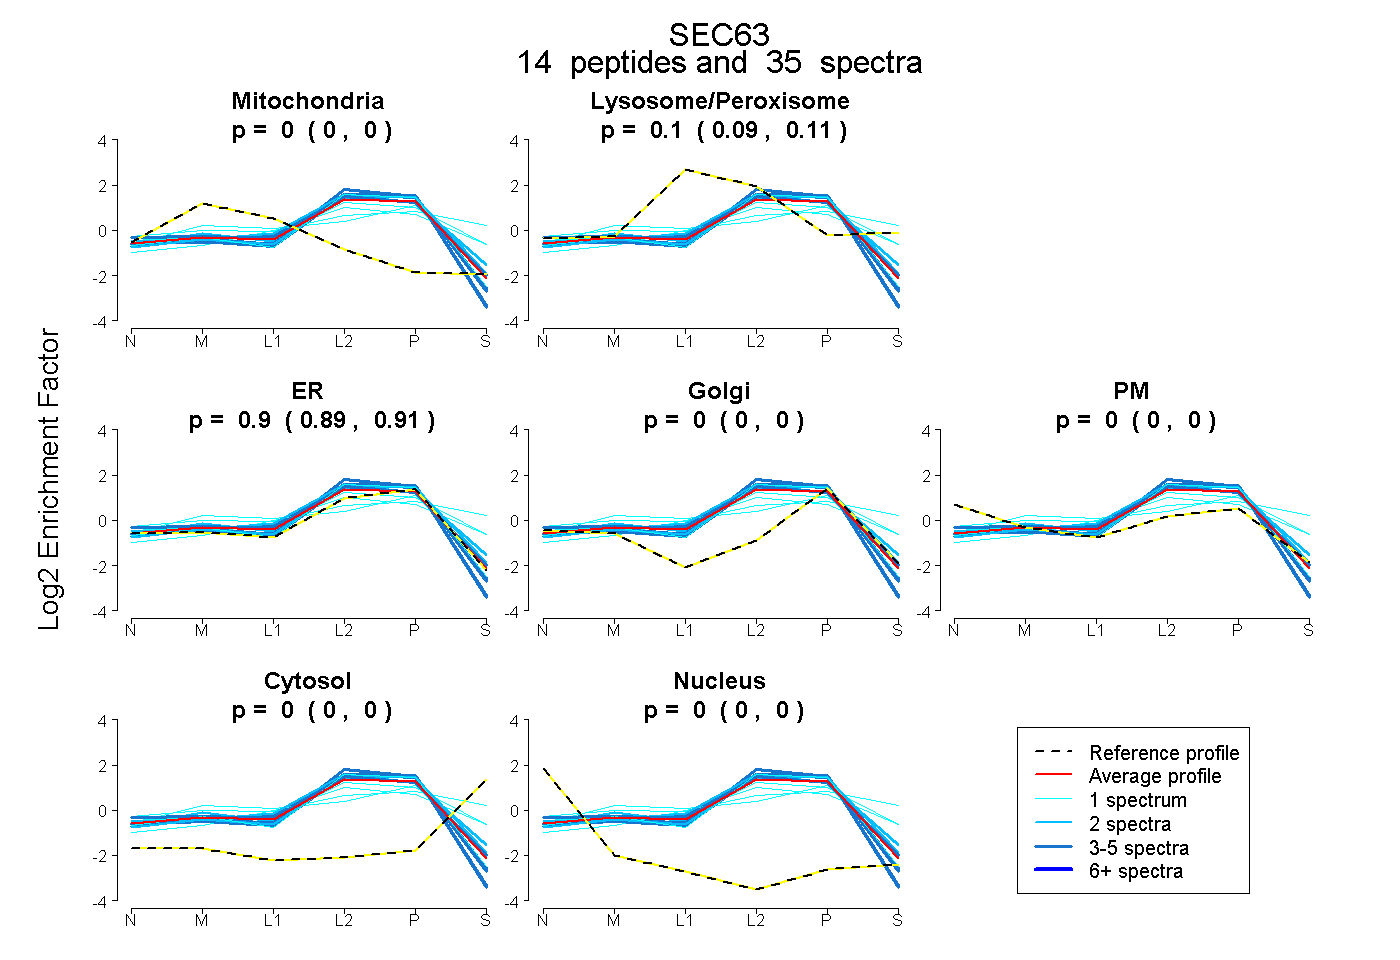
0.000 | 0.000
0.089 | 0.108
0.890 | 0.909
0.000 | 0.000
0.000 | 0.000
0.000 | 0.000
0.000 | 0.000
20peptides
spectra
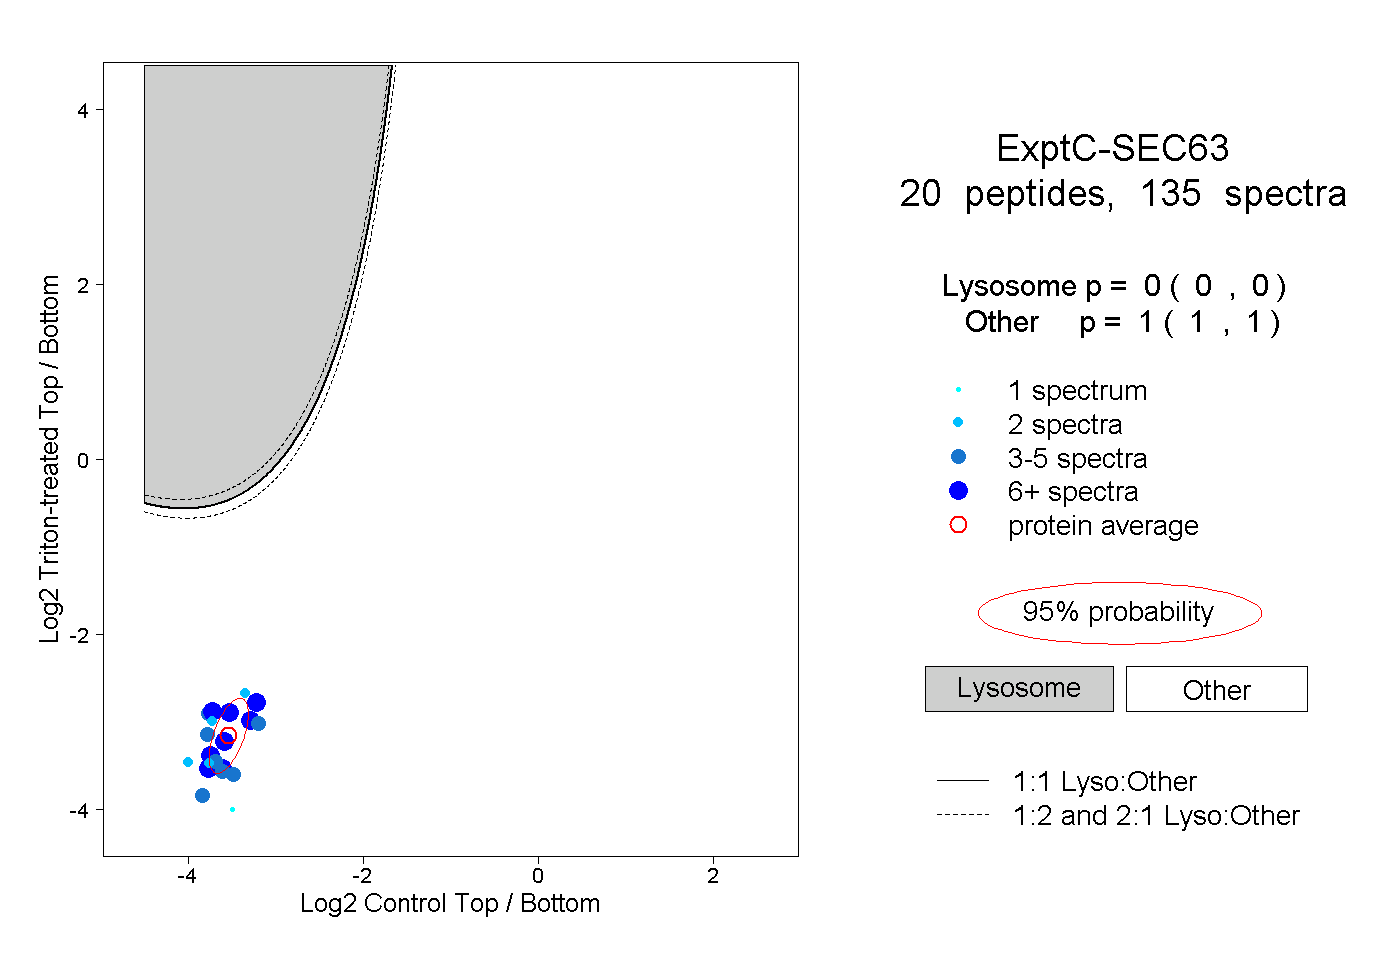
0.000 | 0.000
1.000 | 1.000
7peptides
spectra
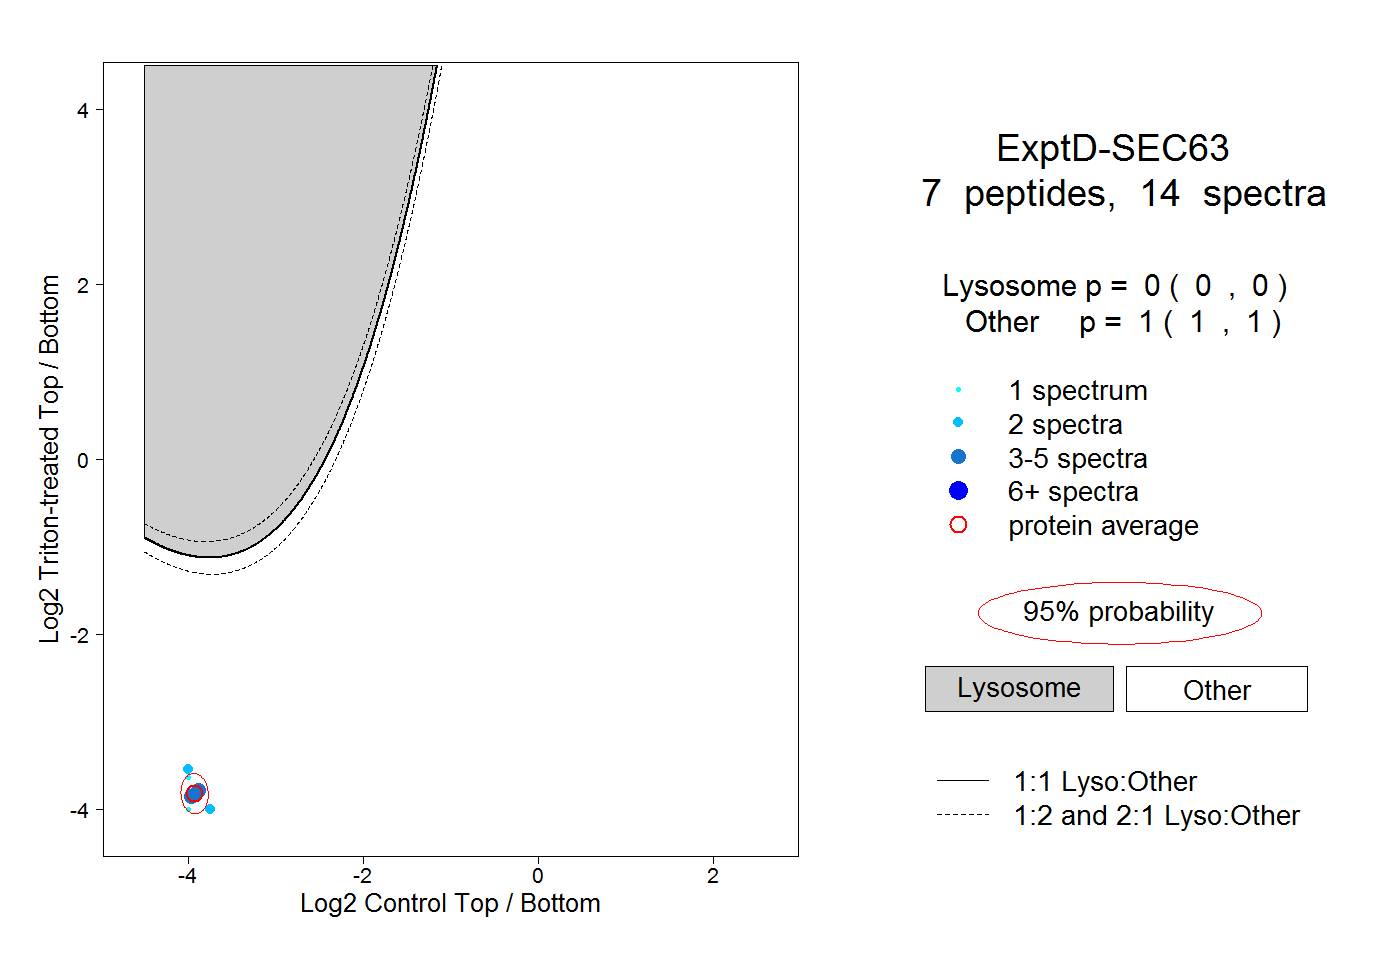
0.000 | 0.000
1.000 | 1.000