 6
6peptides
spectra
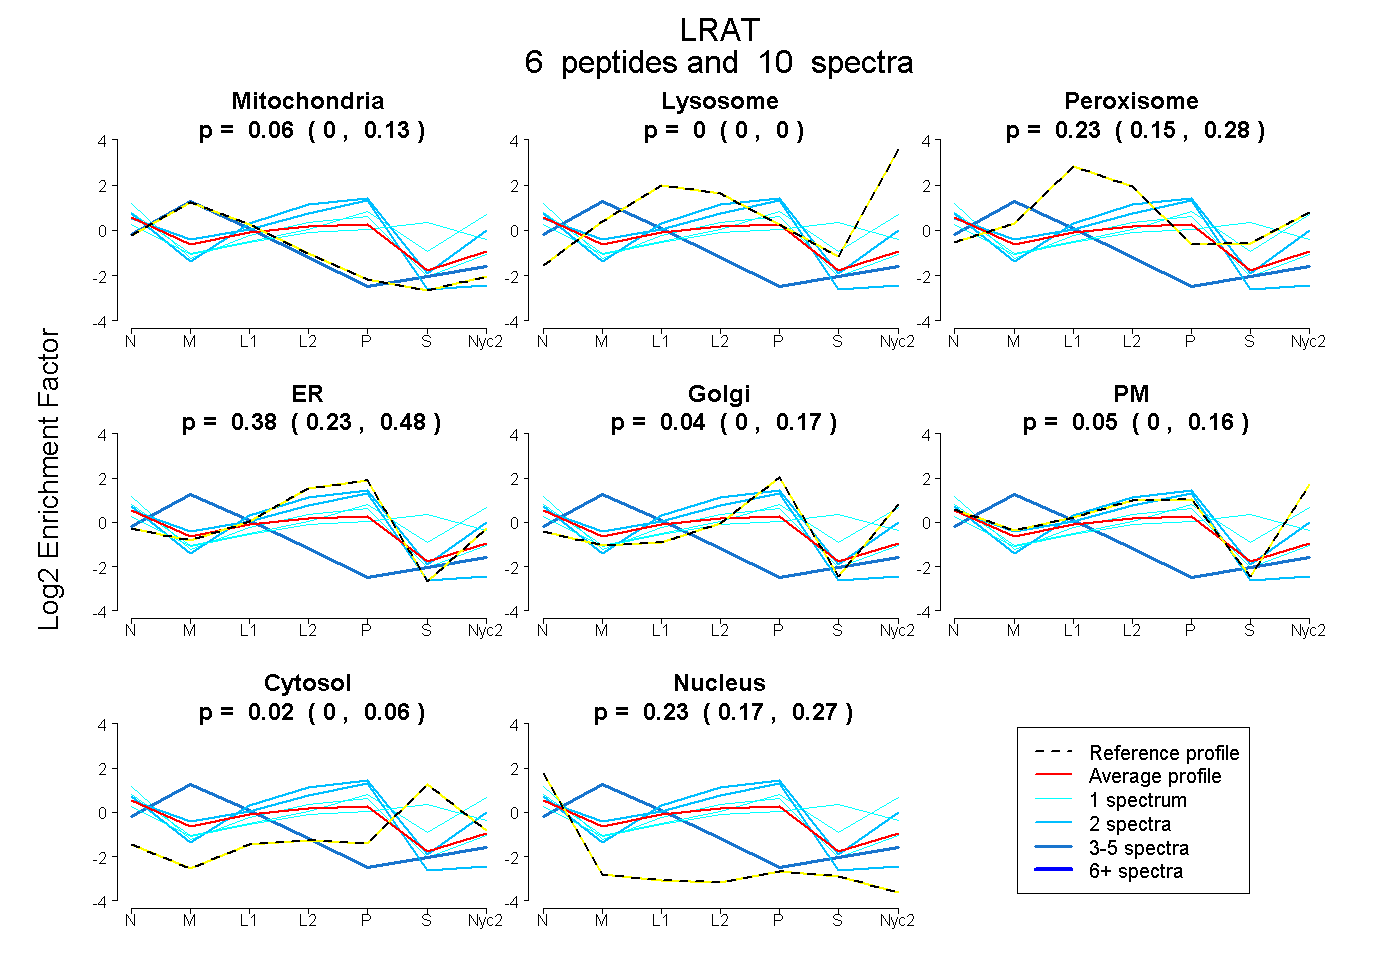
0.000 | 0.129
0.000 | 0.000
0.147 | 0.281
0.229 | 0.479
0.000 | 0.168
0.000 | 0.163
0.000 | 0.058
0.167 | 0.272
3peptides
spectra
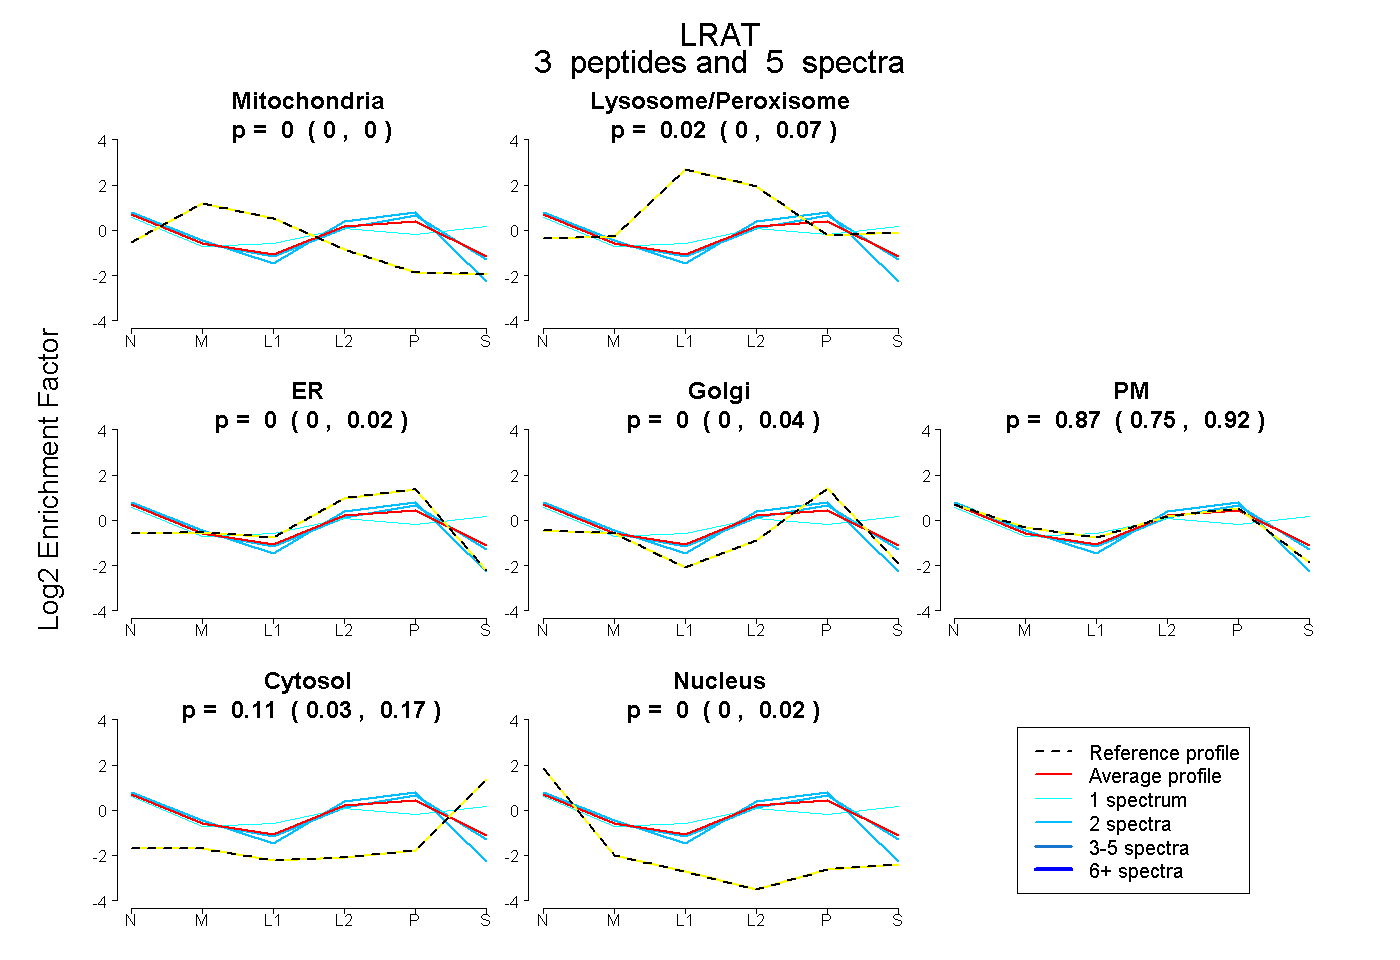
0.000 | 0.000
0.000 | 0.074
0.000 | 0.024
0.000 | 0.038
0.748 | 0.923
0.027 | 0.167
0.000 | 0.021
3peptides
spectra
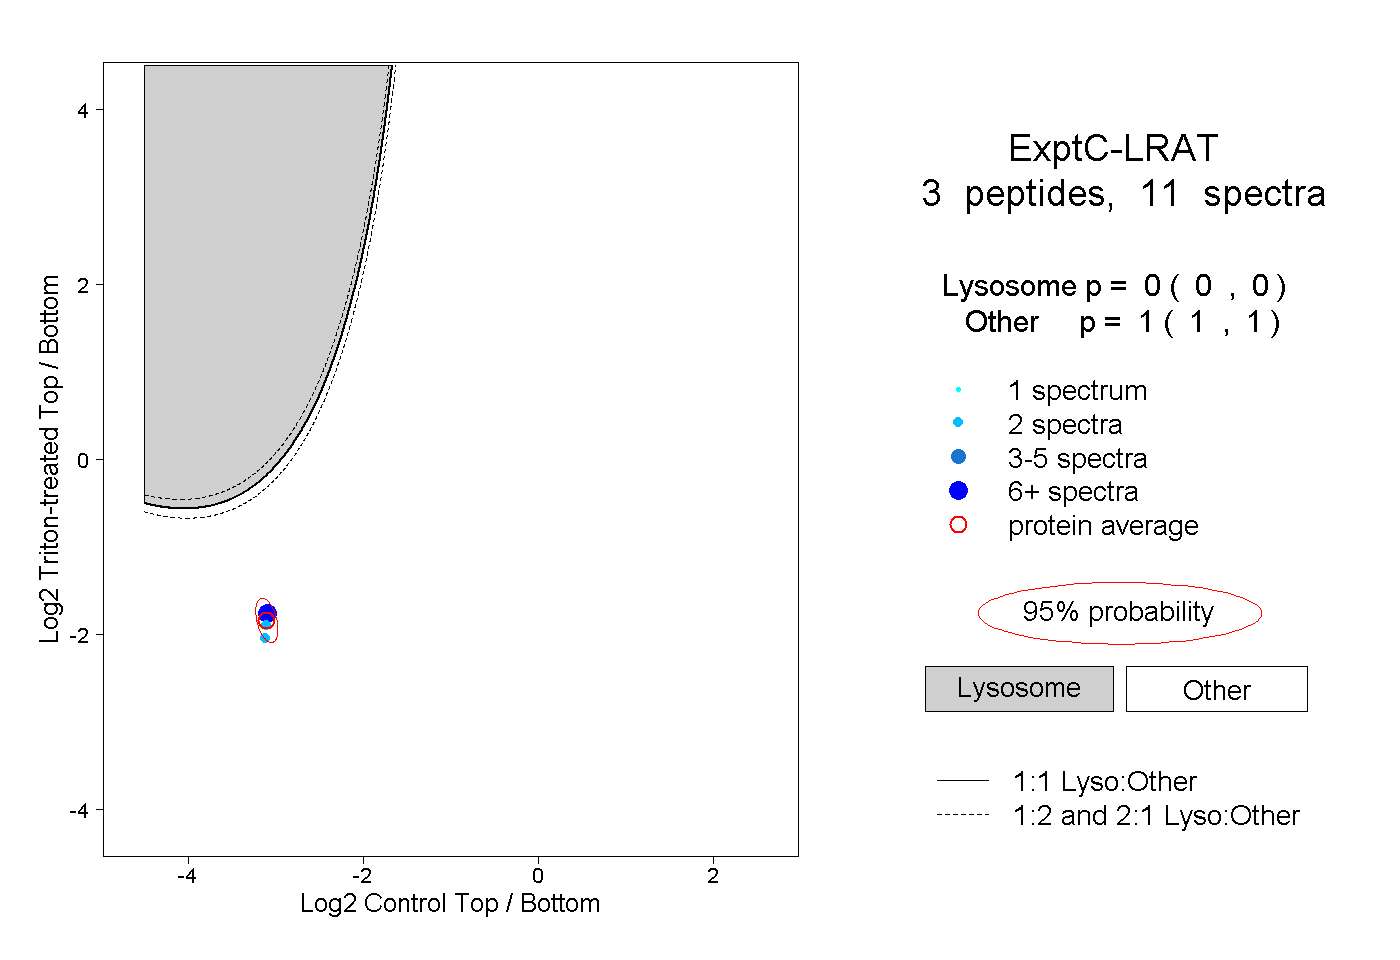
0.000 | 0.000
1.000 | 1.000