 6
6peptides
spectra
0.000 | 0.129
0.000 | 0.000
0.147 | 0.281
0.229 | 0.479
0.000 | 0.168
0.000 | 0.163
0.000 | 0.058
0.167 | 0.272
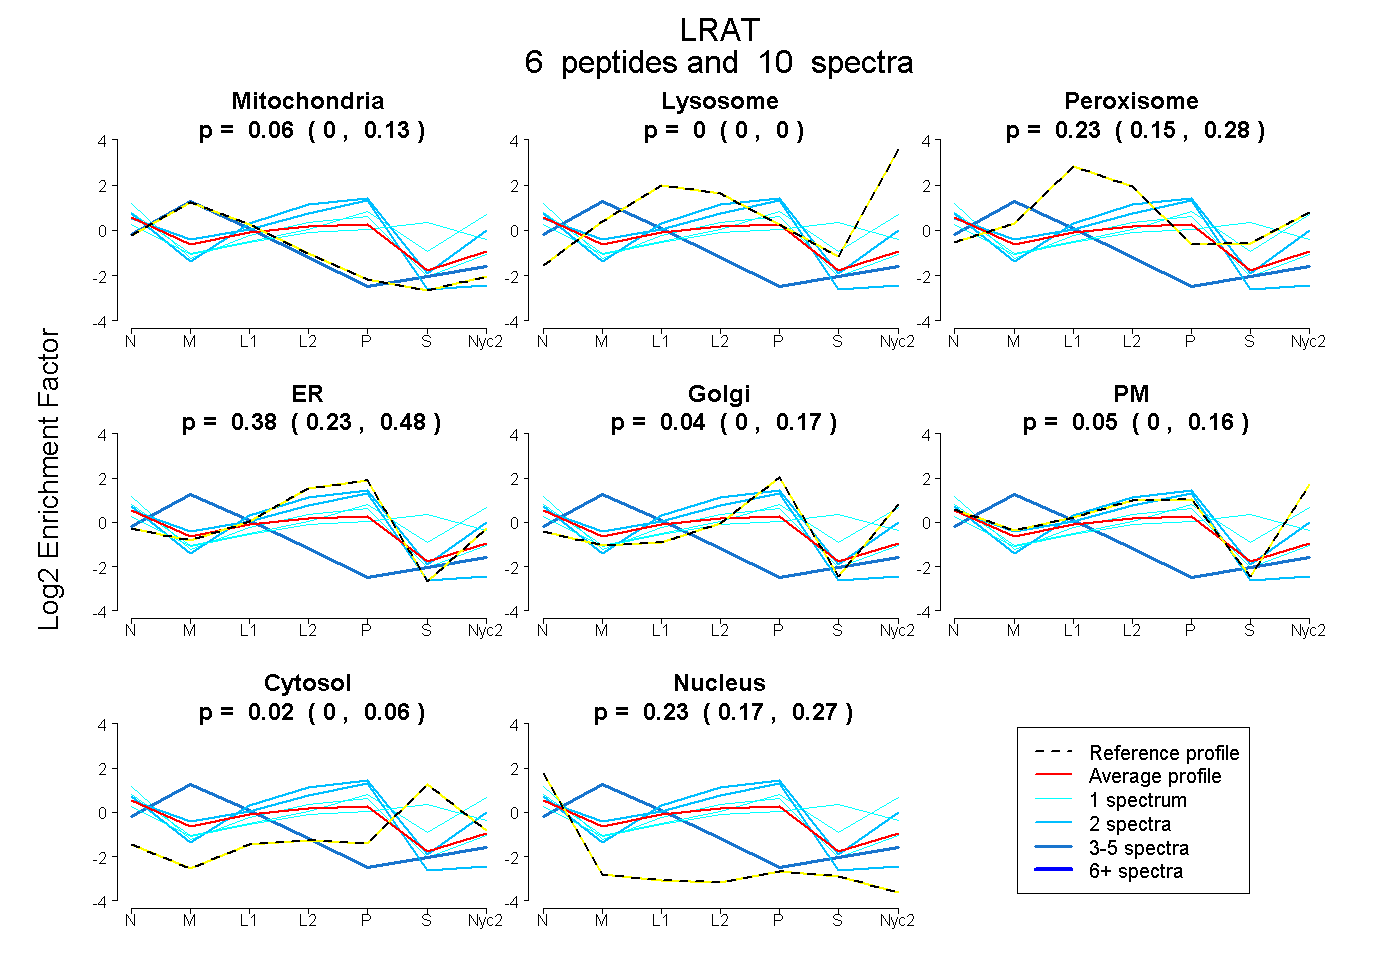
| Plot | Mito | Lyso | Perox | ER | Golgi | PM | Cytosol | Nucleus | |||||
| Expt A |
6 peptides |
10 spectra |
|
0.057 0.000 | 0.129 |
0.000 0.000 | 0.000 |
0.225 0.147 | 0.281 |
0.378 0.229 | 0.479 |
0.045 0.000 | 0.168 |
0.050 0.000 | 0.163 |
0.018 0.000 | 0.058 |
0.228 0.167 | 0.272 |
| 2 spectra, SLLNEEVAR | 0.000 | 0.000 | 0.064 | 0.568 | 0.000 | 0.265 | 0.044 | 0.058 | ||
| 1 spectrum, LLLISNFK | 0.000 | 0.000 | 0.000 | 0.000 | 0.059 | 0.641 | 0.261 | 0.039 | ||
| 1 spectrum, GDVLEVSR | 0.000 | 0.000 | 0.124 | 0.487 | 0.000 | 0.118 | 0.000 | 0.271 | ||
| 1 spectrum, THFTHYGIYLGDNR | 0.000 | 0.000 | 0.124 | 0.095 | 0.000 | 0.246 | 0.500 | 0.035 | ||
| 2 spectra, LLPGVICK | 0.166 | 0.000 | 0.000 | 0.704 | 0.000 | 0.000 | 0.000 | 0.130 | ||
| 3 spectra, IFSVCAPGGGTGK | 0.912 | 0.013 | 0.000 | 0.000 | 0.000 | 0.000 | 0.075 | 0.000 |
| Plot | Mito | Lyso or Perox | ER | Golgi | PM | Cytosol | Nucleus | ||||||
| Expt B |
3 peptides |
5 spectra |
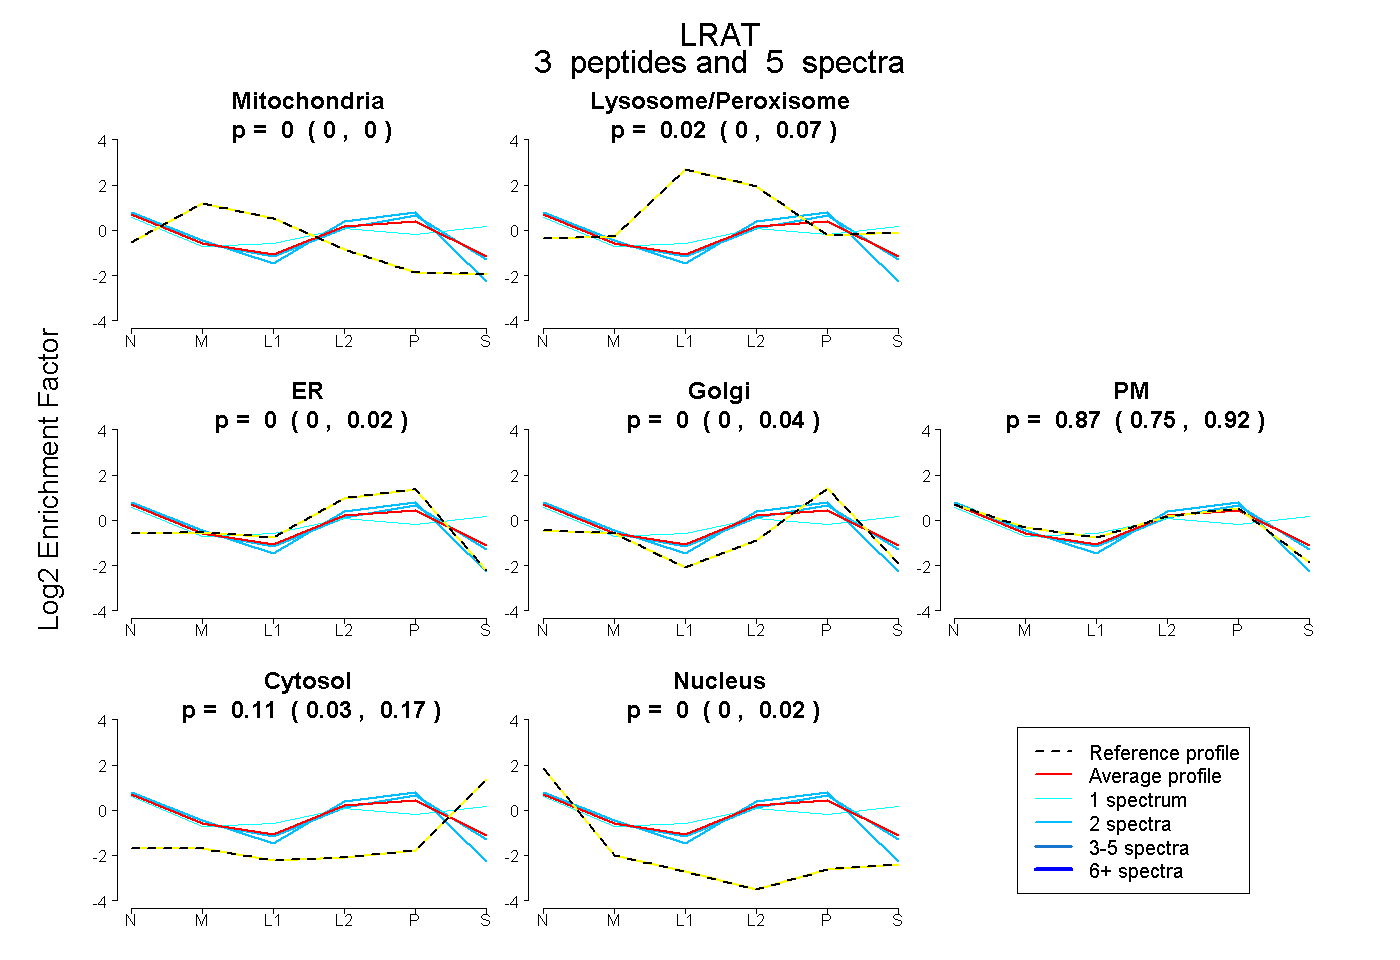 |
0.000 0.000 | 0.000 |
0.019 0.000 | 0.074 |
0.000 0.000 | 0.024 |
0.000 0.000 | 0.038 |
0.873 0.748 | 0.923 |
0.109 0.027 | 0.167 |
0.000 0.000 | 0.021 |
|||
| Plot | Lyso | Other | |||||||||||
| Expt C |
3 peptides |
11 spectra |
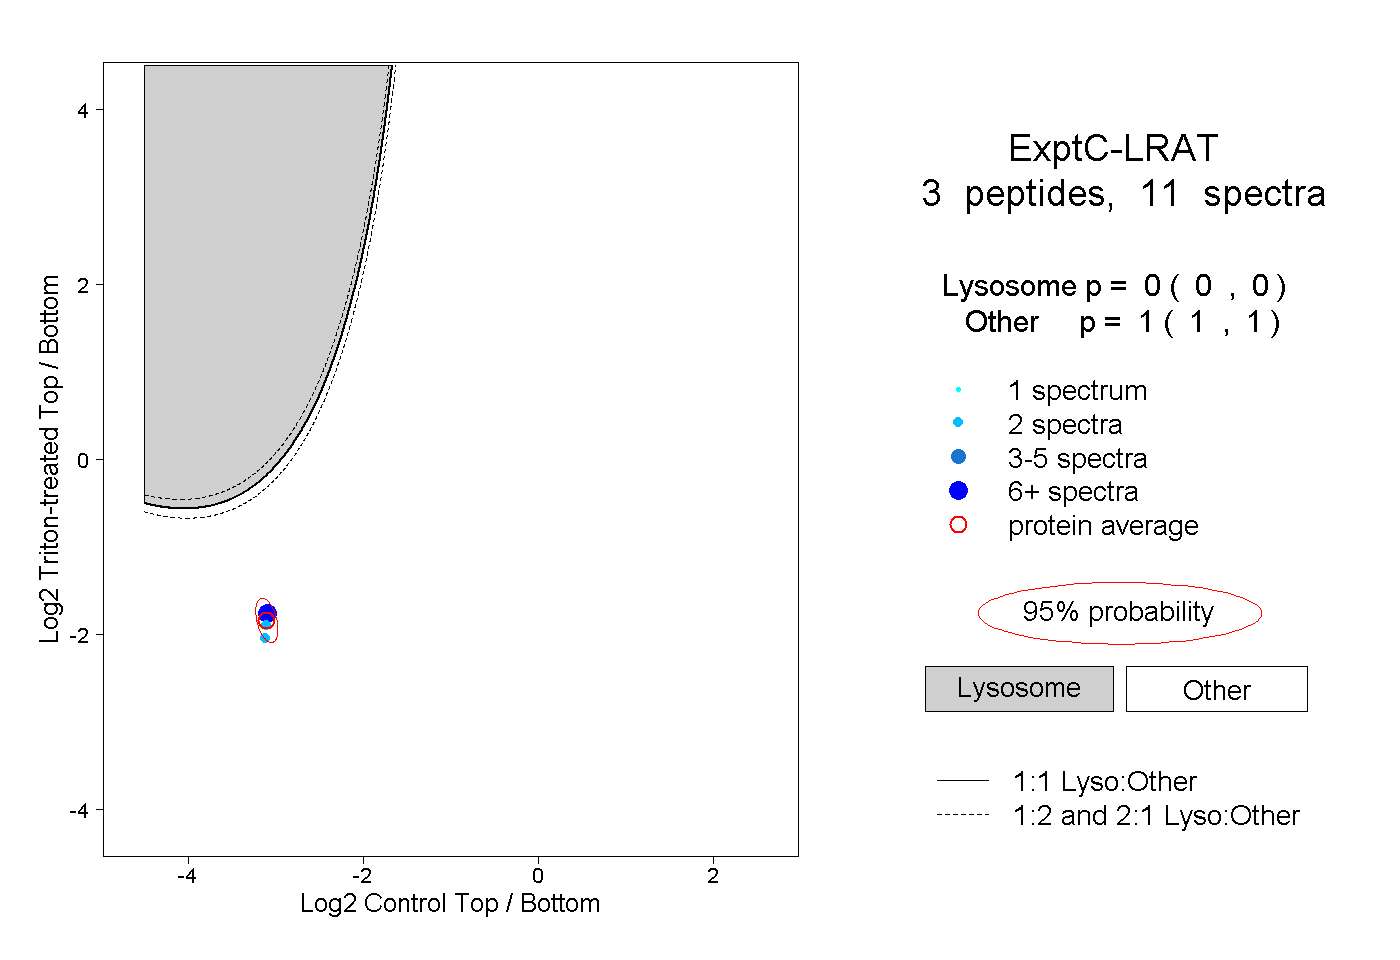 |
0.000 0.000 | 0.000 |
1.000 1.000 | 1.000 |