 13
13peptides
spectra
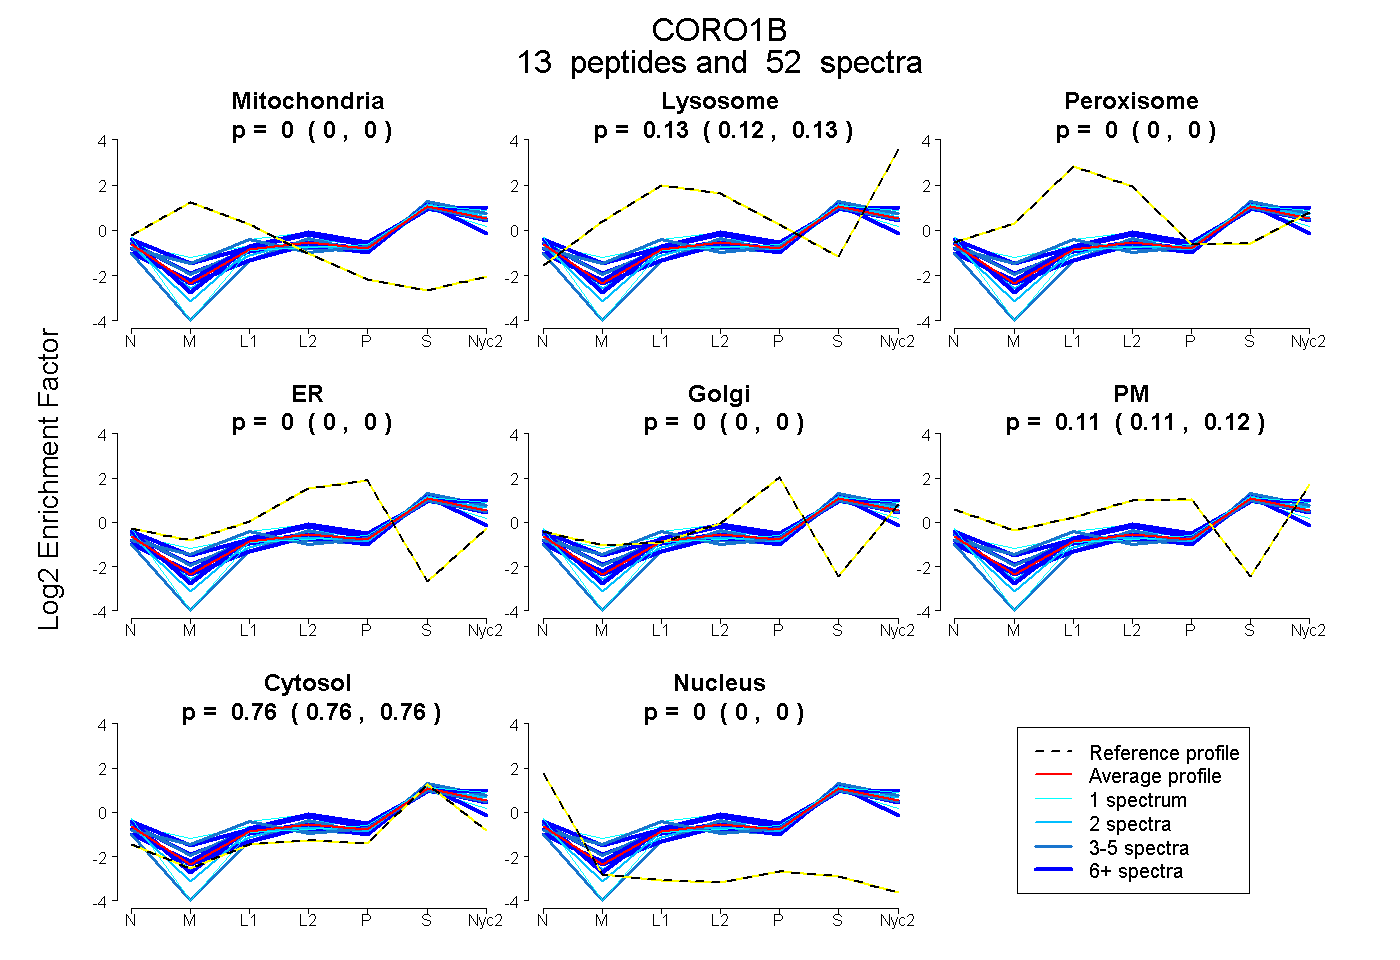
0.000 | 0.000
0.121 | 0.132
0.000 | 0.000
0.000 | 0.000
0.000 | 0.000
0.109 | 0.118
0.755 | 0.762
0.000 | 0.000
5peptides
spectra
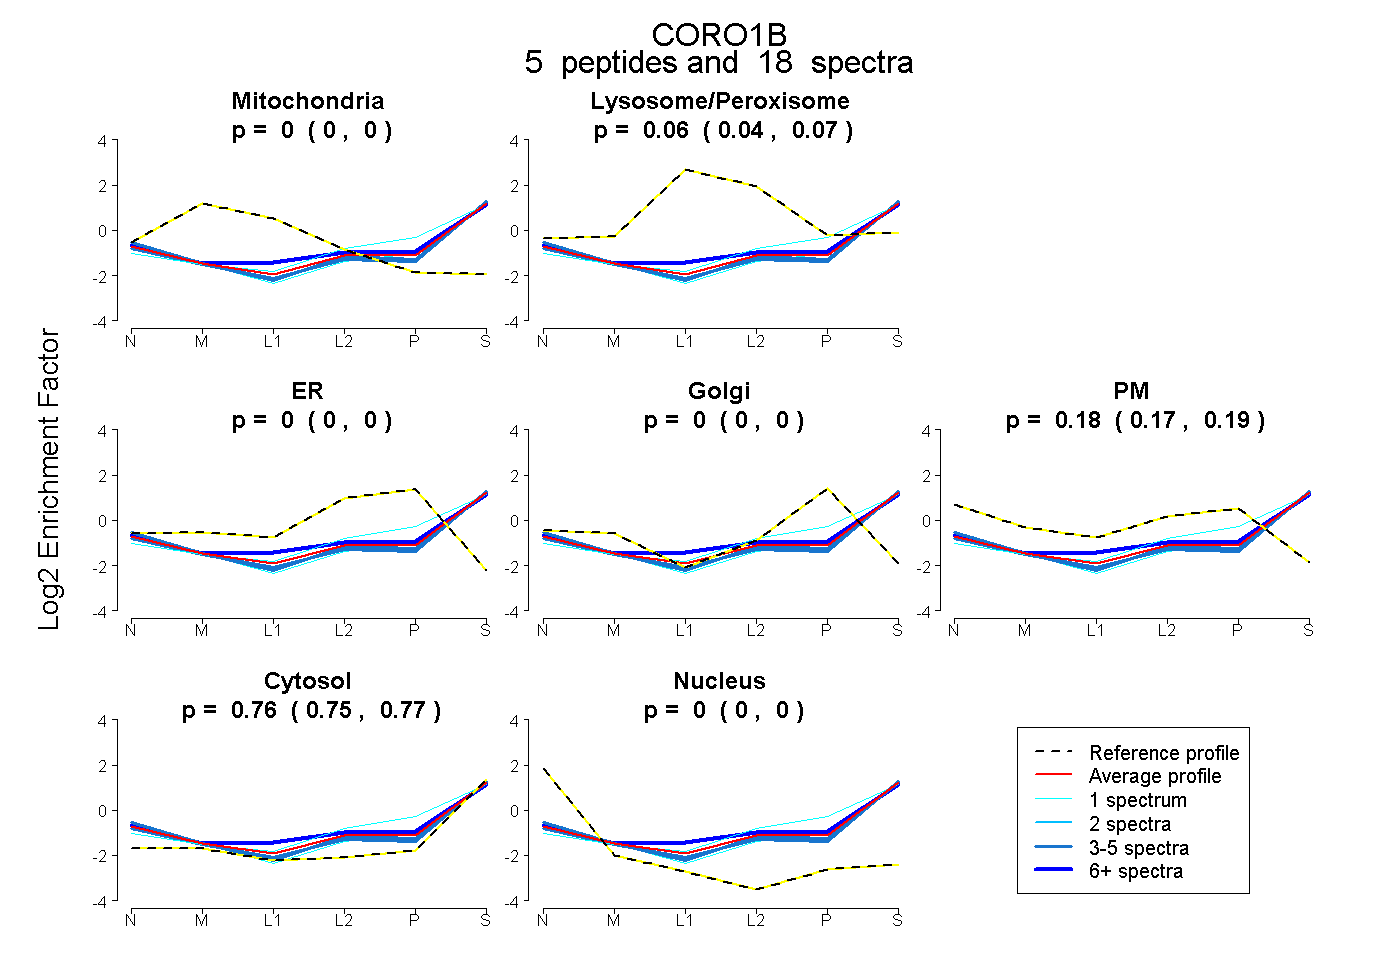
0.000 | 0.000
0.040 | 0.072
0.000 | 0.000
0.000 | 0.000
0.167 | 0.194
0.753 | 0.767
0.000 | 0.000
12peptides
spectra
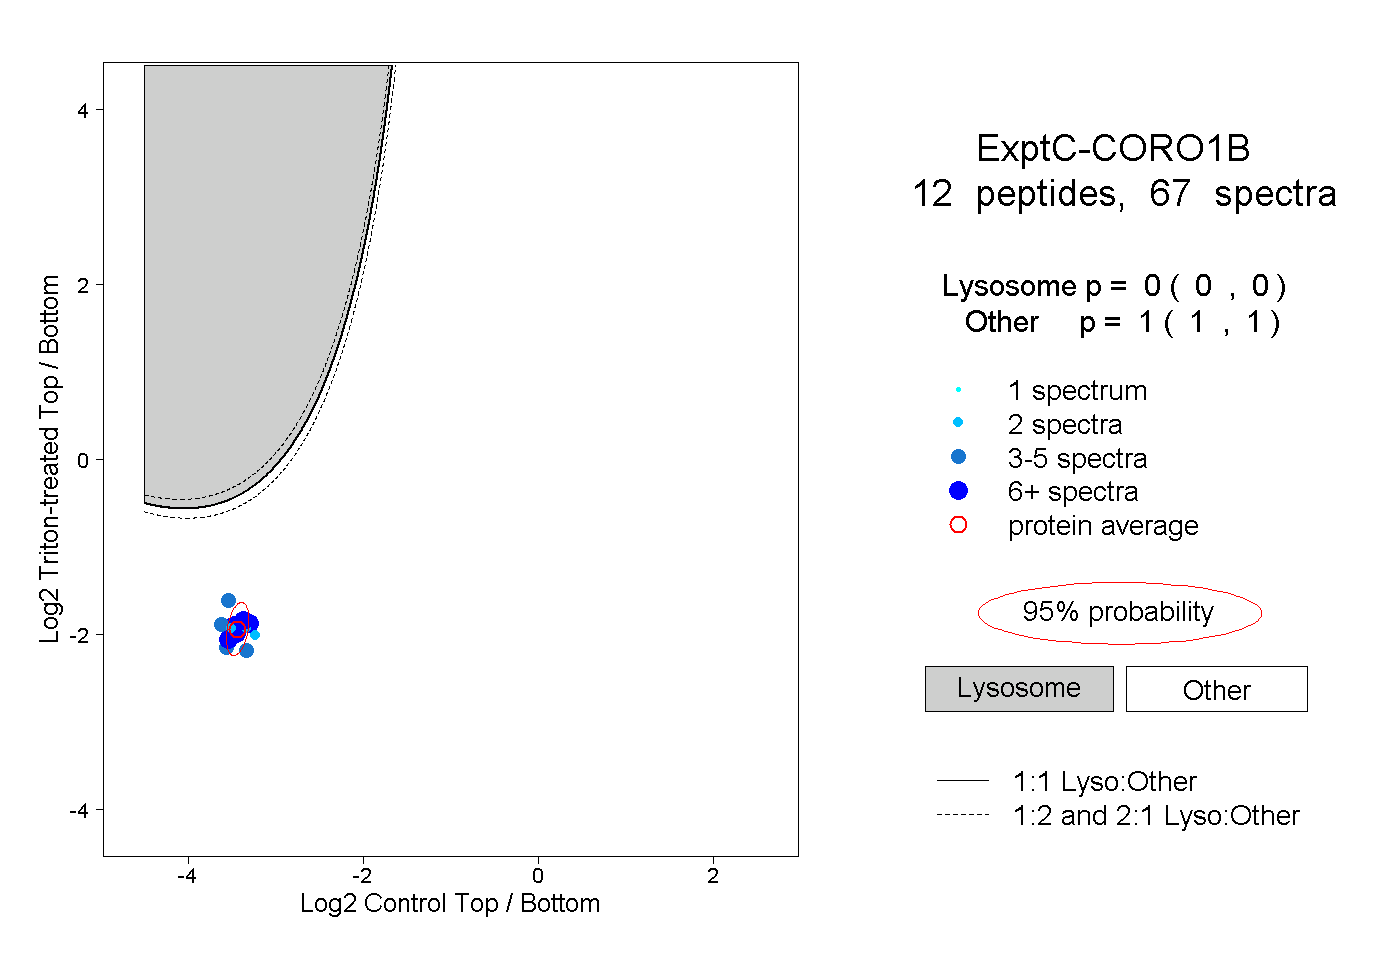
0.000 | 0.000
1.000 | 1.000
3peptides
spectra
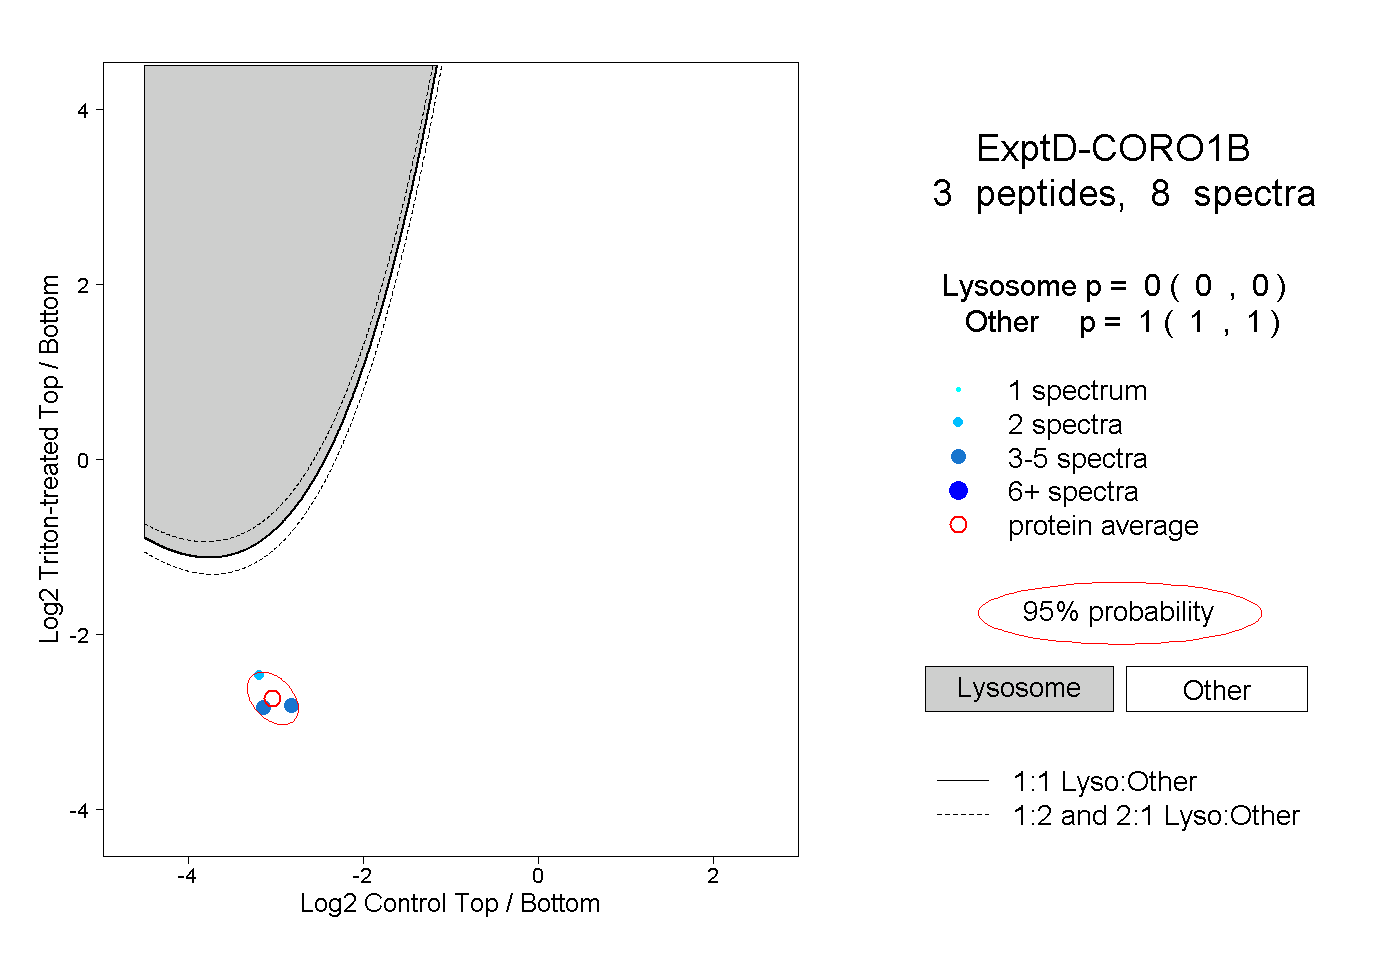
0.000 | 0.000
1.000 | 1.000