 13
13peptides
spectra
0.000 | 0.000
0.121 | 0.132
0.000 | 0.000
0.000 | 0.000
0.000 | 0.000
0.109 | 0.118
0.755 | 0.762
0.000 | 0.000
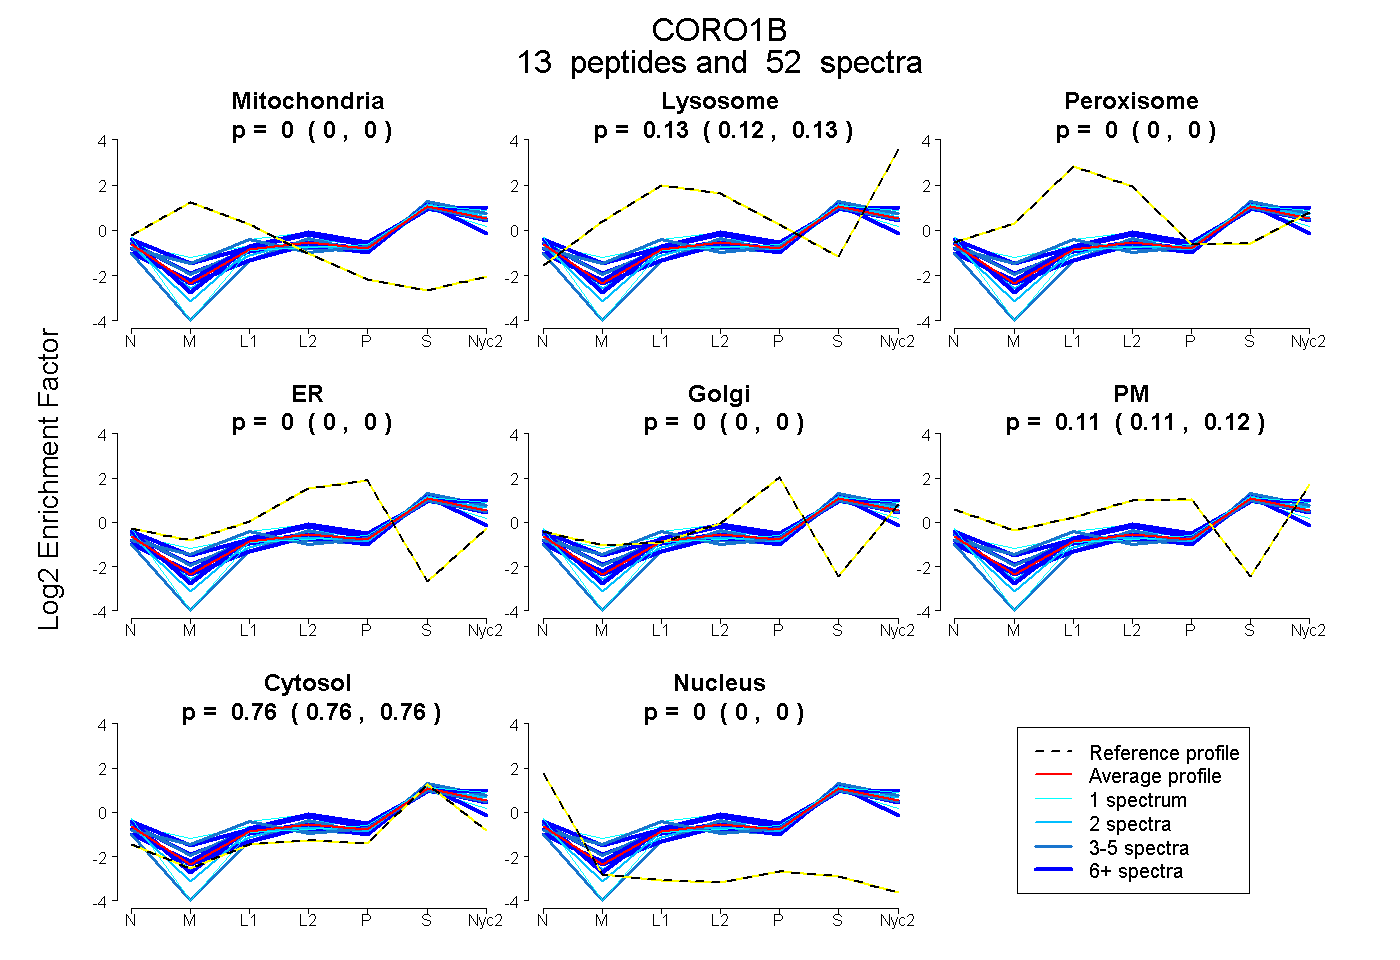
| Plot | Mito | Lyso | Perox | ER | Golgi | PM | Cytosol | Nucleus | |||||
| Expt A |
13 peptides |
52 spectra |
|
0.000 0.000 | 0.000 |
0.127 0.121 | 0.132 |
0.000 0.000 | 0.000 |
0.000 0.000 | 0.000 |
0.000 0.000 | 0.000 |
0.114 0.109 | 0.118 |
0.759 0.755 | 0.762 |
0.000 0.000 | 0.000 |
| 6 spectra, NDQCYEDIR | 0.000 | 0.021 | 0.000 | 0.000 | 0.000 | 0.130 | 0.849 | 0.000 | ||
| 9 spectra, VFTTGFSR | 0.000 | 0.212 | 0.000 | 0.000 | 0.000 | 0.151 | 0.638 | 0.000 | ||
| 1 spectrum, CEPIVMTVPR | 0.000 | 0.078 | 0.139 | 0.000 | 0.000 | 0.169 | 0.614 | 0.000 | ||
| 6 spectra, AIFLADGK | 0.000 | 0.123 | 0.000 | 0.000 | 0.000 | 0.137 | 0.740 | 0.000 | ||
| 2 spectra, NVLSDSKPAGYSR | 0.000 | 0.085 | 0.000 | 0.000 | 0.000 | 0.098 | 0.817 | 0.000 | ||
| 7 spectra, LEEHLGR | 0.000 | 0.087 | 0.000 | 0.000 | 0.000 | 0.194 | 0.720 | 0.000 | ||
| 2 spectra, GTLVAER | 0.000 | 0.098 | 0.000 | 0.000 | 0.000 | 0.147 | 0.755 | 0.000 | ||
| 1 spectrum, HVFGQPVK | 0.014 | 0.089 | 0.114 | 0.000 | 0.000 | 0.087 | 0.696 | 0.000 | ||
| 1 spectrum, VTWDSTFCAVNPK | 0.000 | 0.013 | 0.000 | 0.000 | 0.000 | 0.175 | 0.812 | 0.000 | ||
| 3 spectra, EAYVPSK | 0.000 | 0.130 | 0.000 | 0.000 | 0.000 | 0.112 | 0.757 | 0.000 | ||
| 5 spectra, LEEVMQELR | 0.000 | 0.101 | 0.000 | 0.000 | 0.000 | 0.012 | 0.887 | 0.000 | ||
| 6 spectra, GMGSMPK | 0.000 | 0.201 | 0.000 | 0.000 | 0.000 | 0.014 | 0.785 | 0.000 | ||
| 3 spectra, VGIITWHPTAR | 0.000 | 0.215 | 0.009 | 0.000 | 0.000 | 0.056 | 0.719 | 0.000 |
| Plot | Mito | Lyso or Perox | ER | Golgi | PM | Cytosol | Nucleus | ||||||
| Expt B |
5 peptides |
18 spectra |
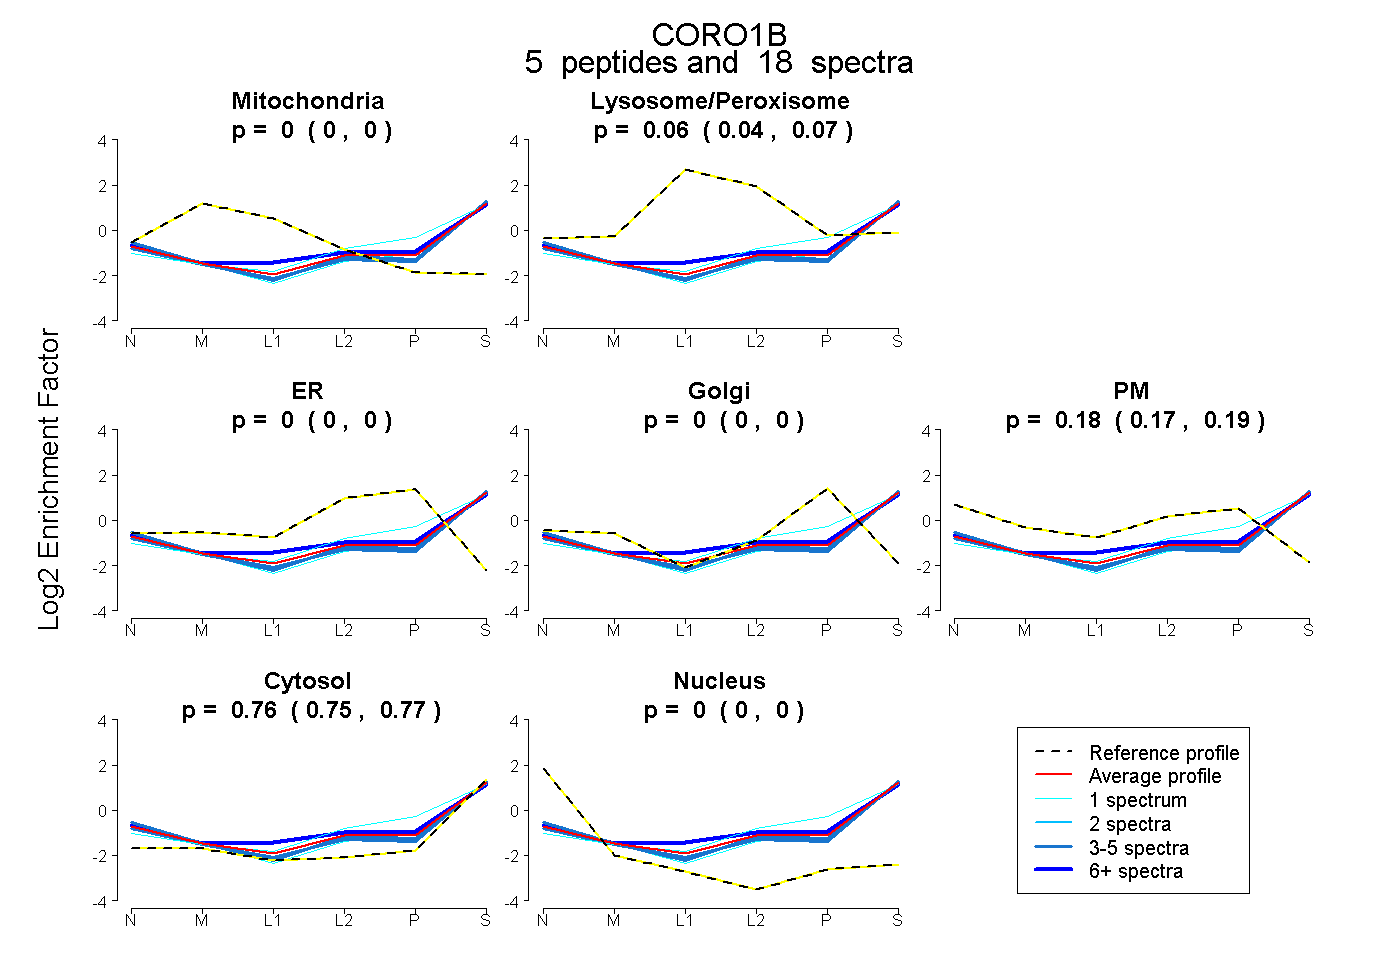 |
0.000 0.000 | 0.000 |
0.058 0.040 | 0.072 |
0.000 0.000 | 0.000 |
0.000 0.000 | 0.000 |
0.182 0.167 | 0.194 |
0.760 0.753 | 0.767 |
0.000 0.000 | 0.000 |
|||
| Plot | Lyso | Other | |||||||||||
| Expt C |
12 peptides |
67 spectra |
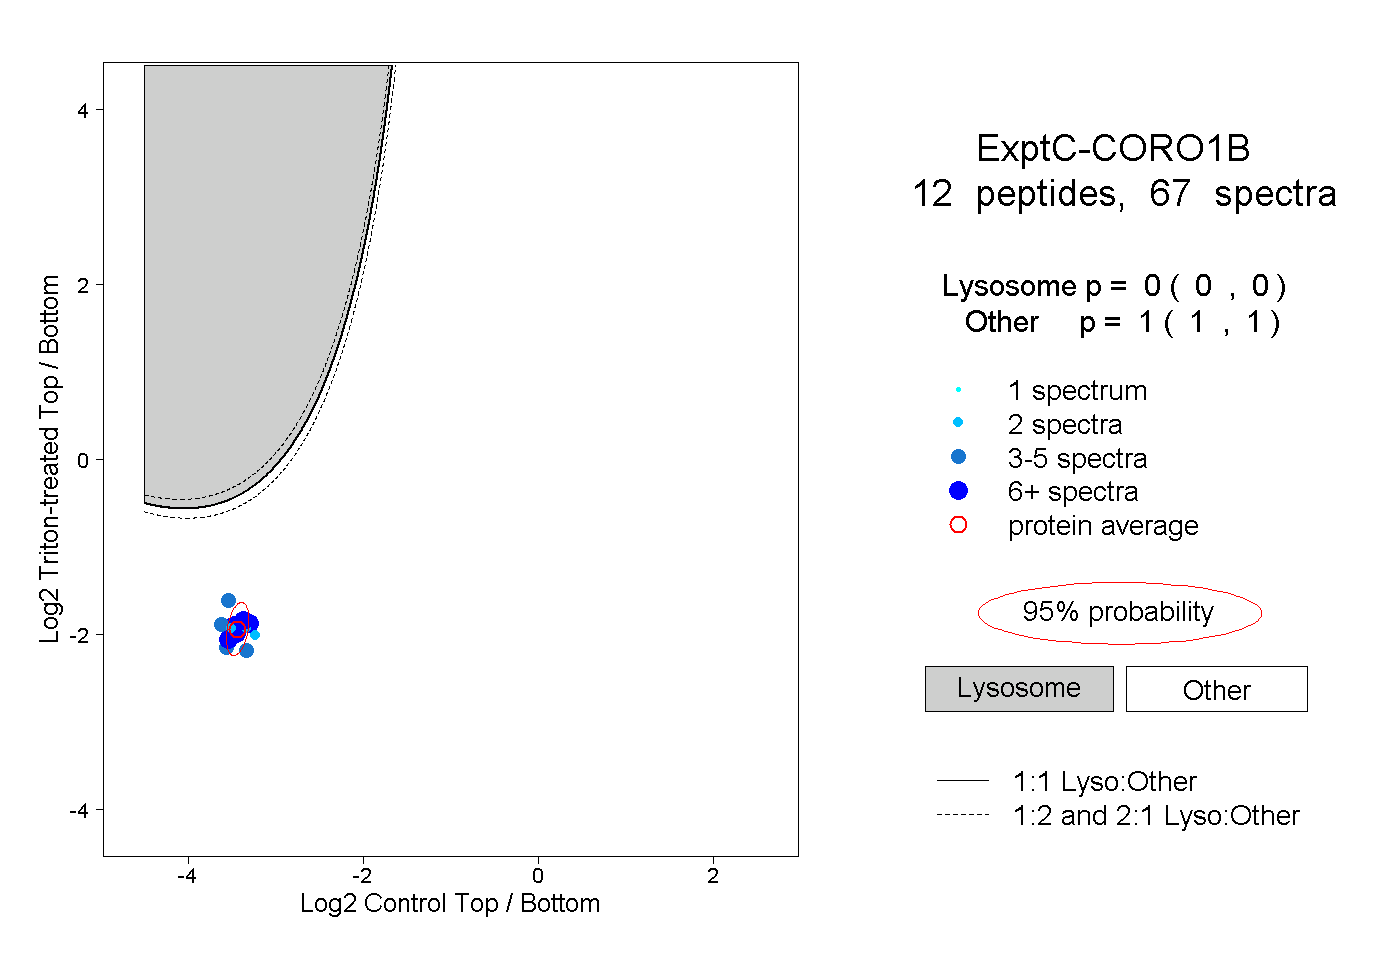 |
0.000 0.000 | 0.000 |
1.000 1.000 | 1.000 |
||||||||
| Plot | Lyso | Other | |||||||||||
| Expt D |
3 peptides |
8 spectra |
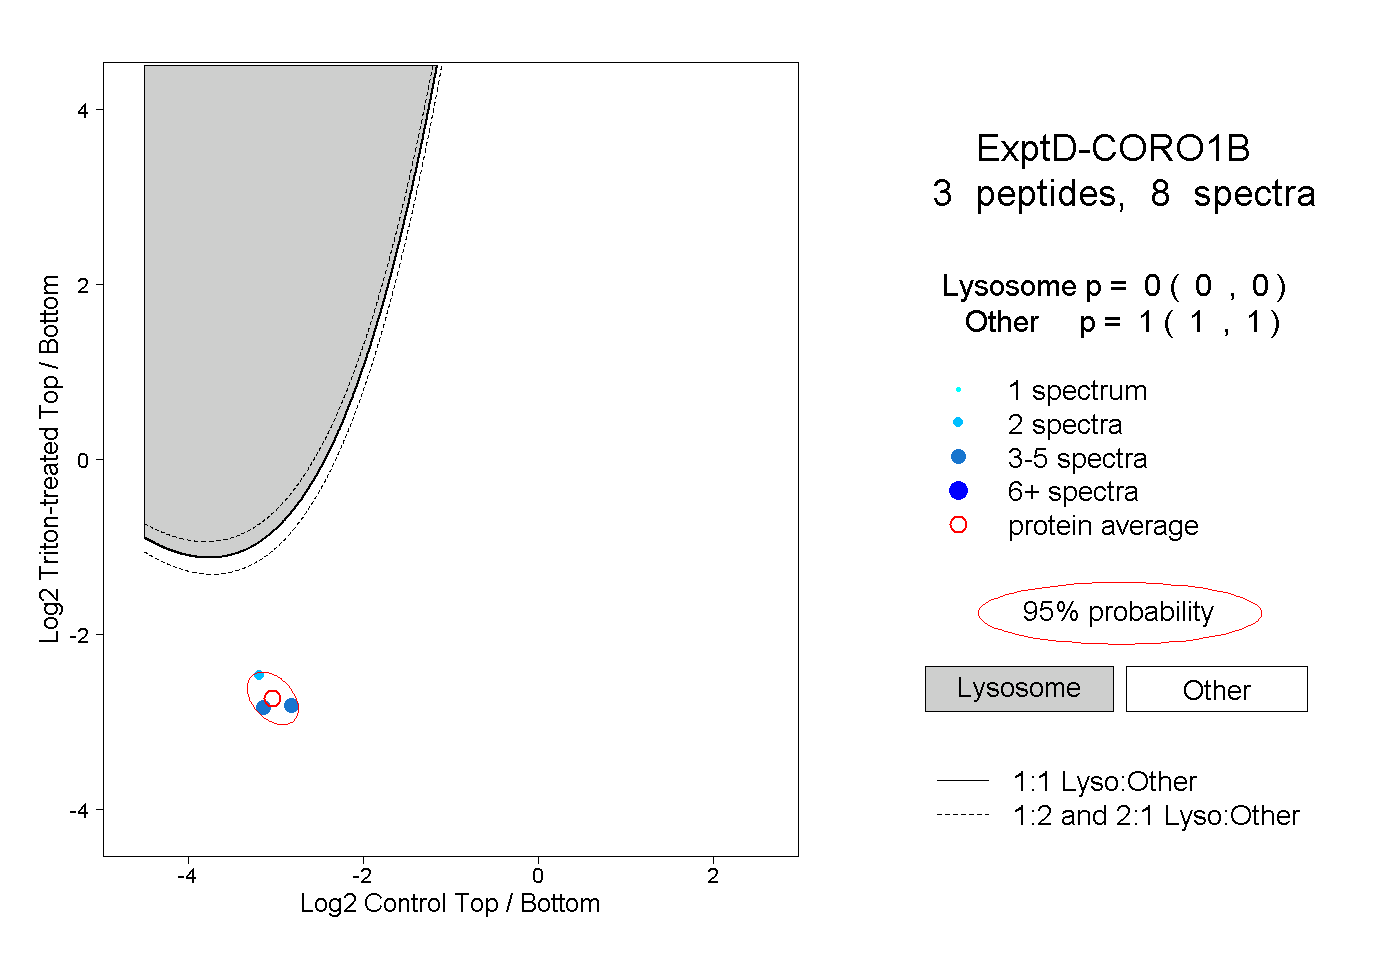 |
0.000 0.000 | 0.000 |
1.000 1.000 | 1.000 |