 3
3peptides
spectra
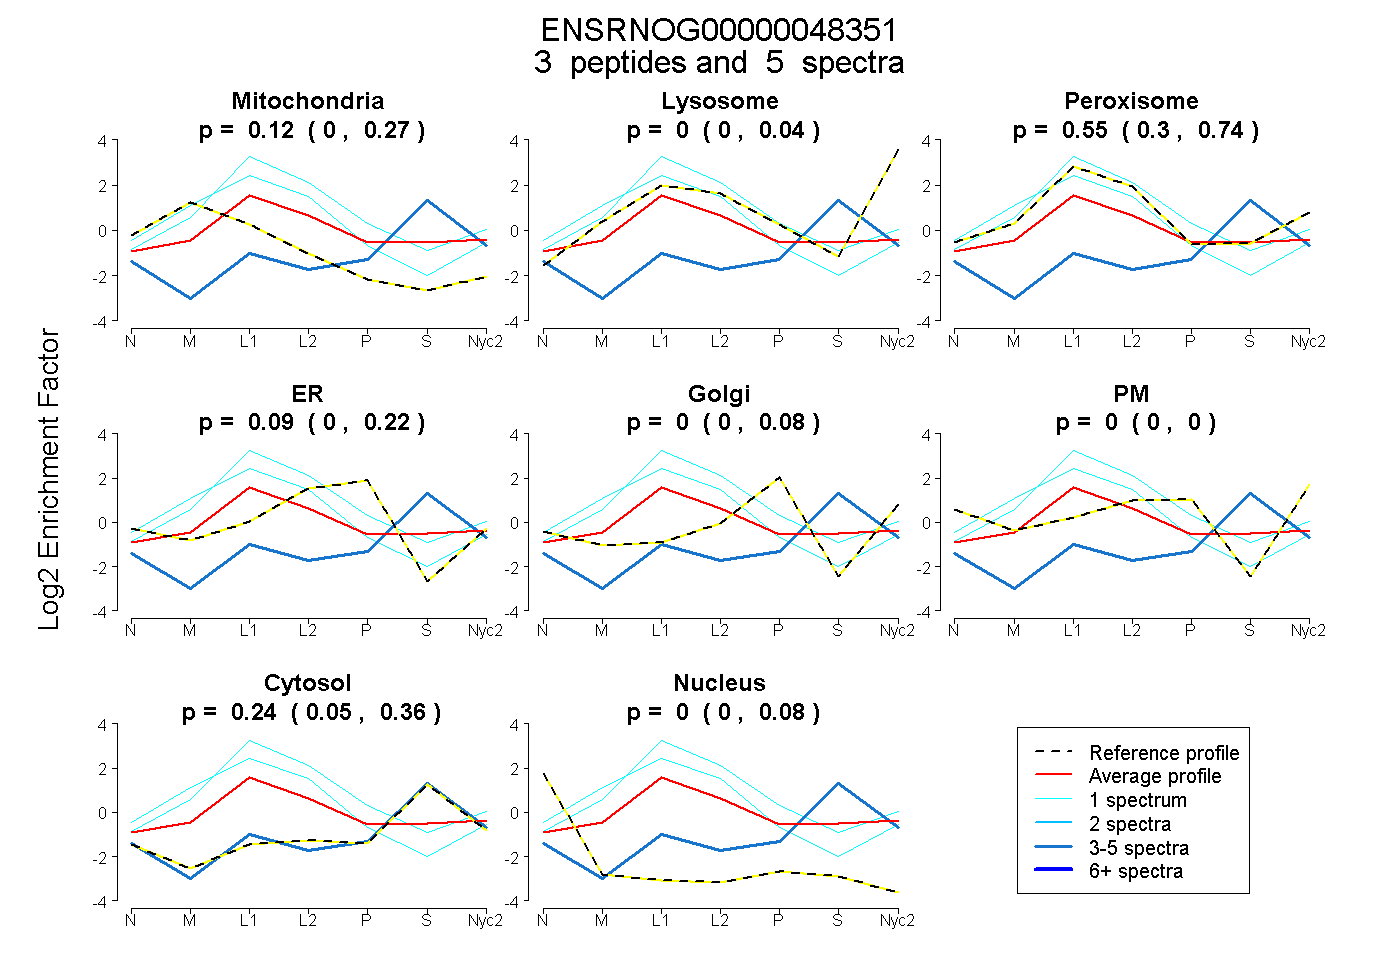
0.000 | 0.274
0.000 | 0.038
0.302 | 0.738
0.000 | 0.221
0.000 | 0.078
0.000 | 0.000
0.047 | 0.363
0.000 | 0.084
1peptide
spectrum
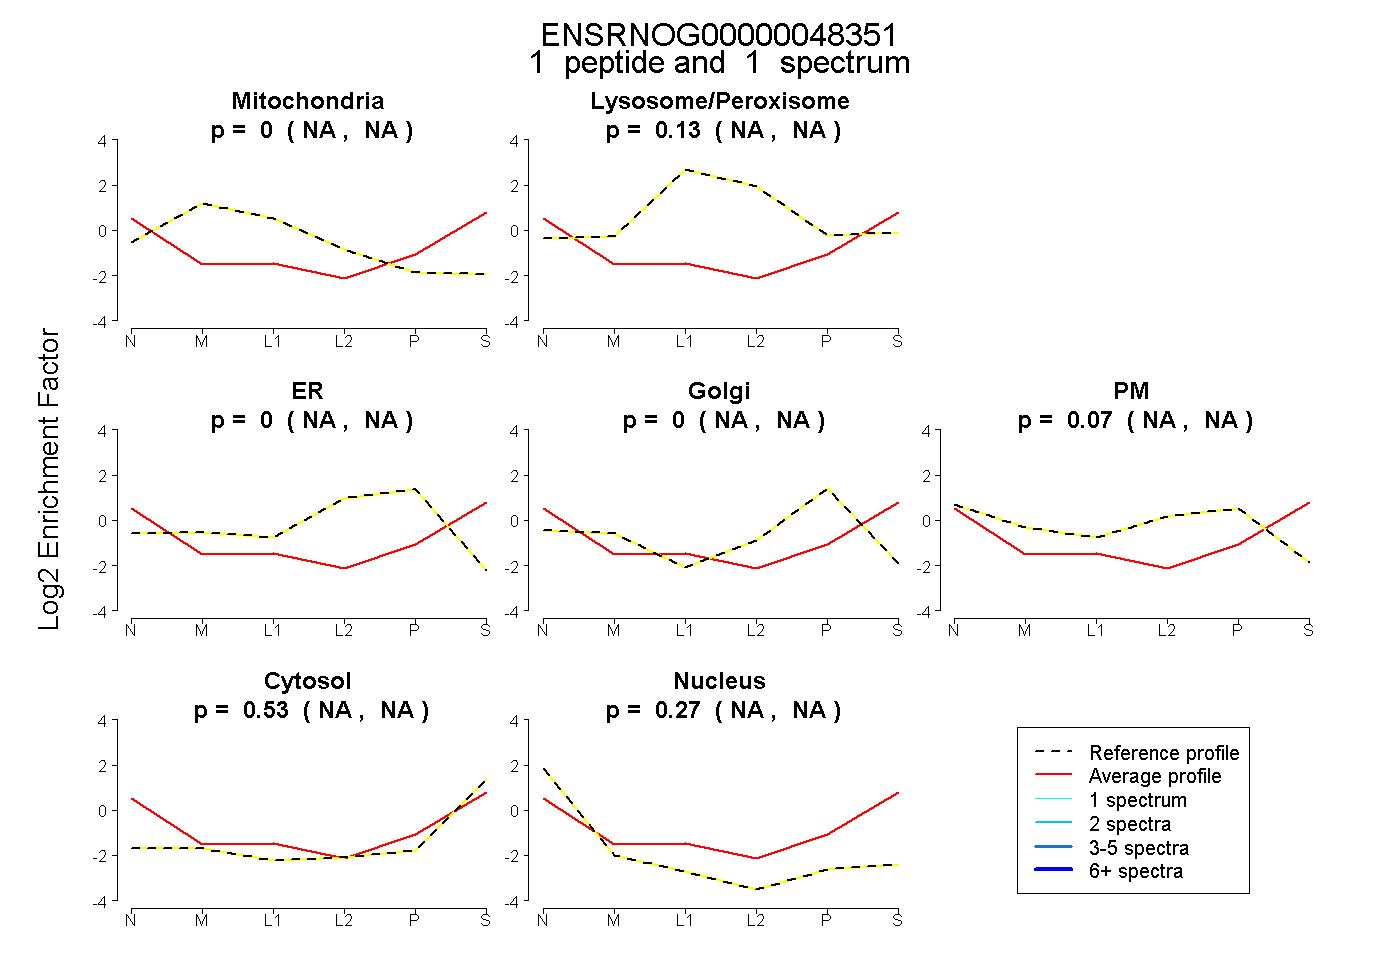
NA | NA
NA | NA
NA | NA
NA | NA
NA | NA
NA | NA
NA | NA
1peptide
spectra
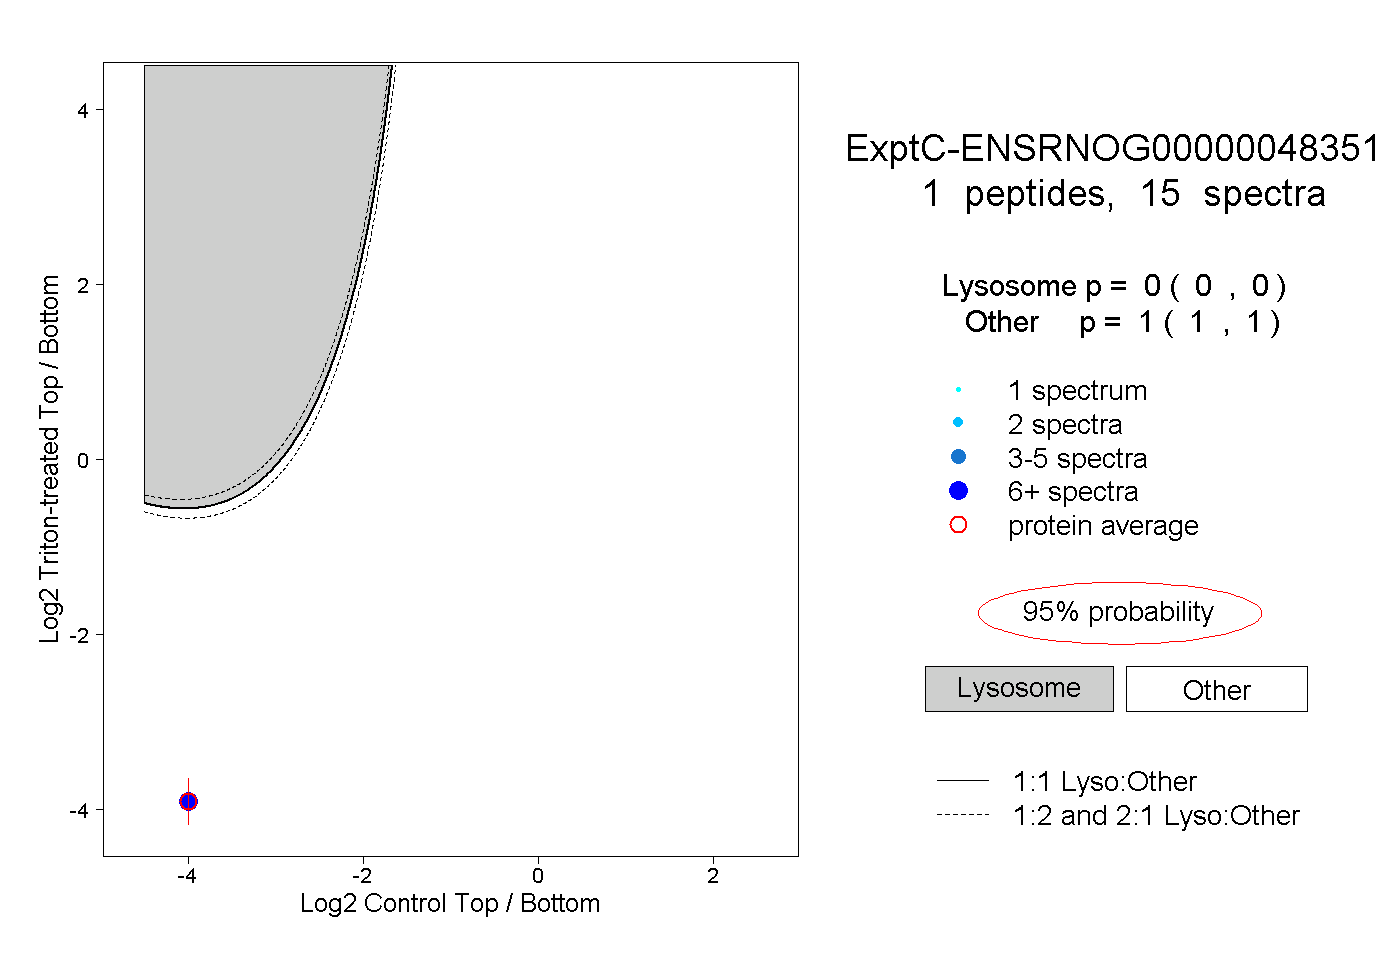
0.000 | 0.000
1.000 | 1.000