 3
3peptides
spectra
0.000 | 0.274
0.000 | 0.038
0.302 | 0.738
0.000 | 0.221
0.000 | 0.078
0.000 | 0.000
0.047 | 0.363
0.000 | 0.084
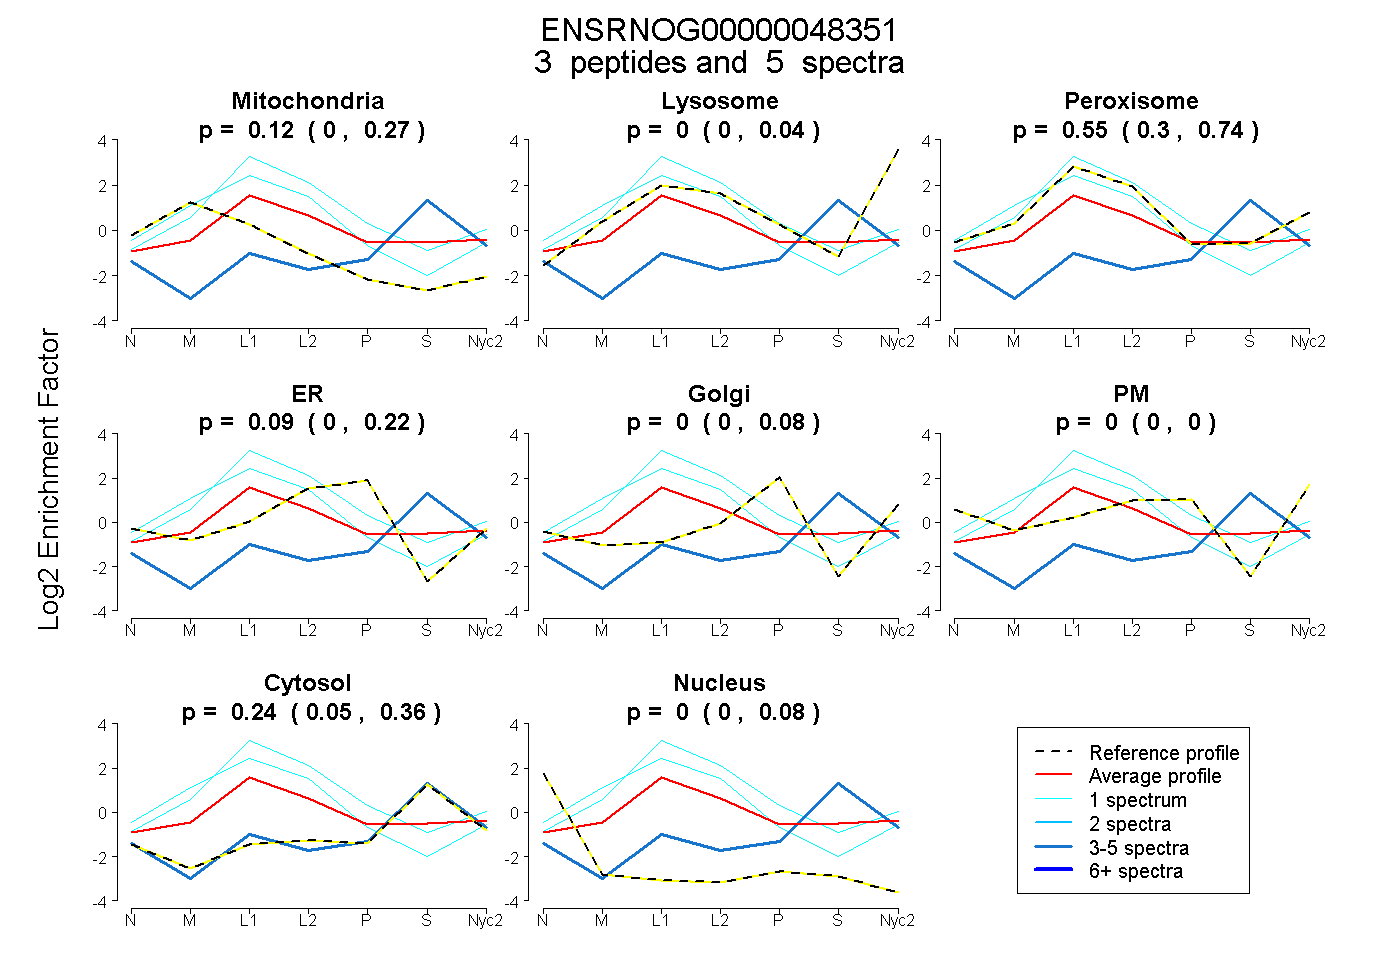
| Plot | Mito | Lyso | Perox | ER | Golgi | PM | Cytosol | Nucleus | |||||
| Expt A |
3 peptides |
5 spectra |
|
0.122 0.000 | 0.274 |
0.000 0.000 | 0.038 |
0.551 0.302 | 0.738 |
0.086 0.000 | 0.221 |
0.000 0.000 | 0.078 |
0.000 0.000 | 0.000 |
0.240 0.047 | 0.363 |
0.000 0.000 | 0.084 |
| 1 spectrum, SAMVTK | 0.294 | 0.000 | 0.638 | 0.067 | 0.000 | 0.000 | 0.000 | 0.000 | ||
| 3 spectra, VEAPPAK | 0.000 | 0.000 | 0.000 | 0.000 | 0.000 | 0.000 | 1.000 | 0.000 | ||
| 1 spectrum, SAPAYK | 0.000 | 0.000 | 0.902 | 0.098 | 0.000 | 0.000 | 0.000 | 0.000 |
| Plot | Mito | Lyso or Perox | ER | Golgi | PM | Cytosol | Nucleus | ||||||
| Expt B |
1 peptide |
1 spectrum |
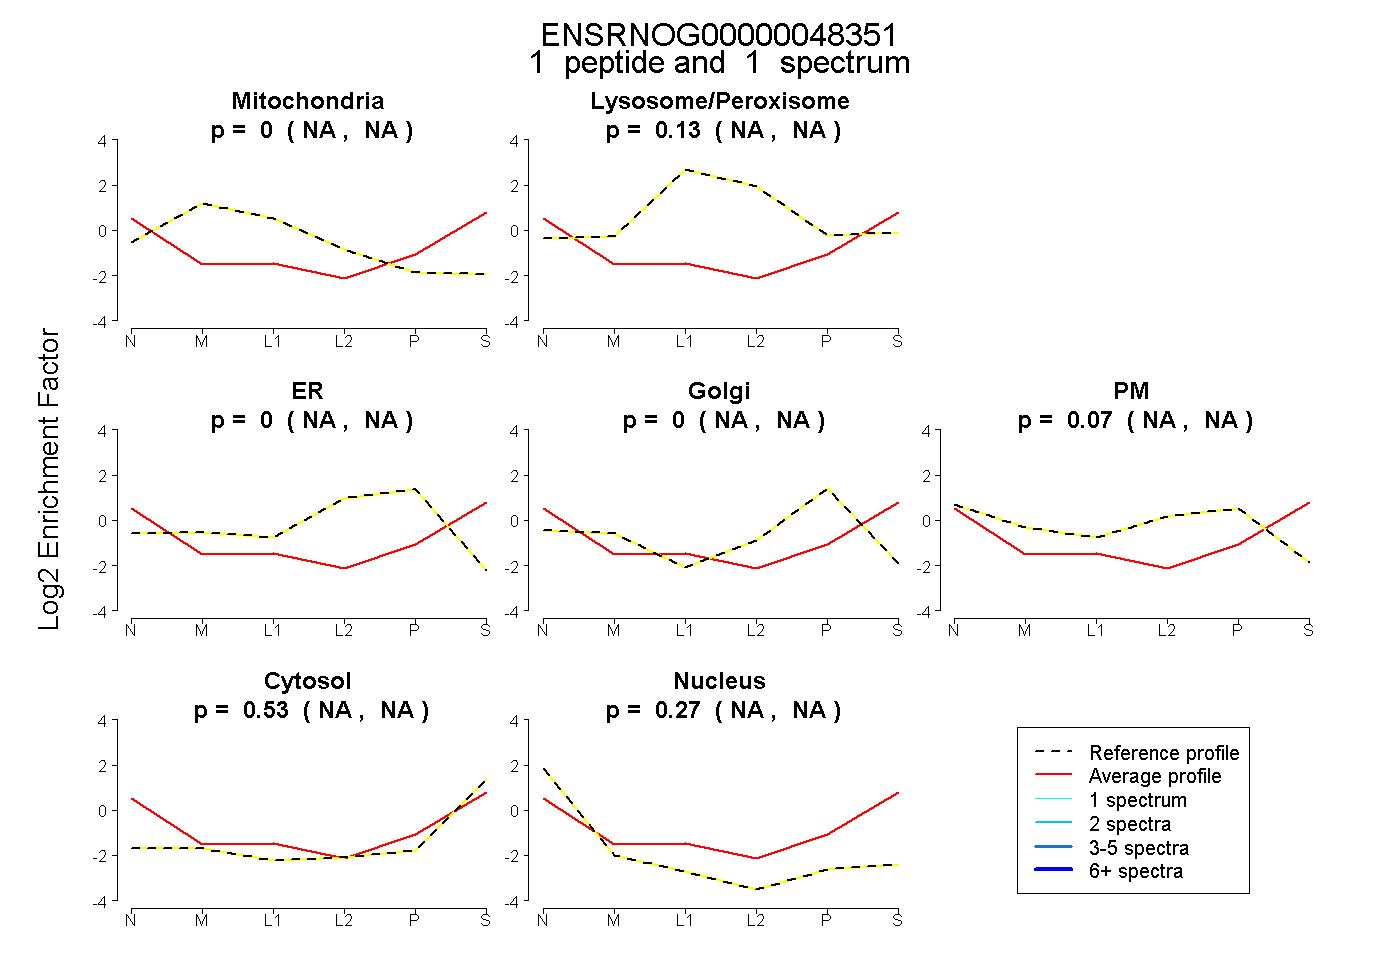 |
0.000 NA | NA |
0.131 NA | NA |
0.000 NA | NA |
0.000 NA | NA |
0.073 NA | NA |
0.526 NA | NA |
0.270 NA | NA |
|||
| Plot | Lyso | Other | |||||||||||
| Expt C |
1 peptide |
15 spectra |
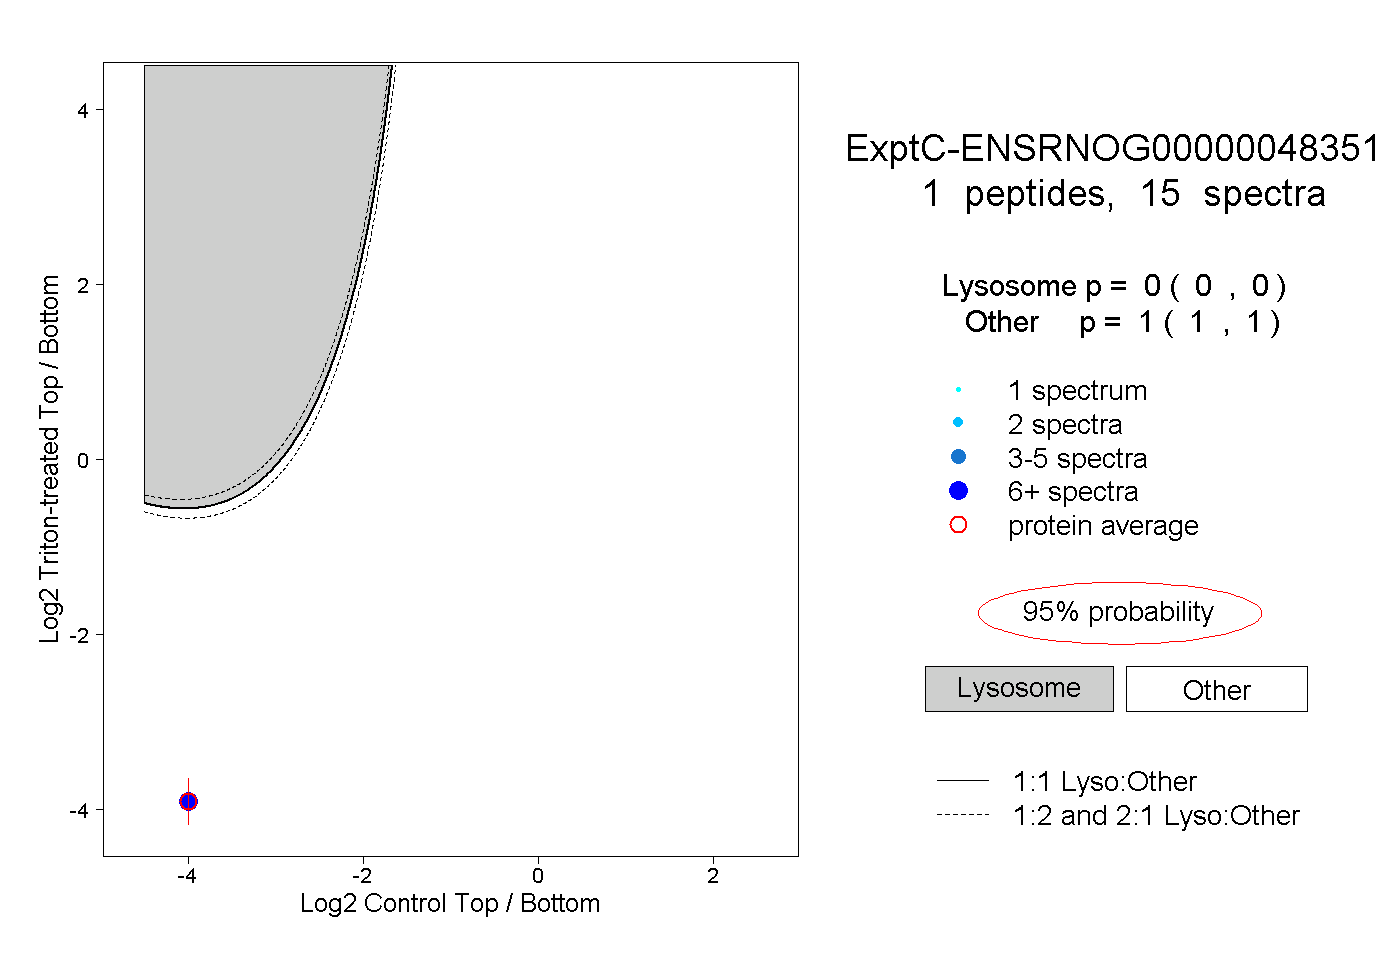 |
0.000 0.000 | 0.000 |
1.000 1.000 | 1.000 |