 8
8peptides
spectra
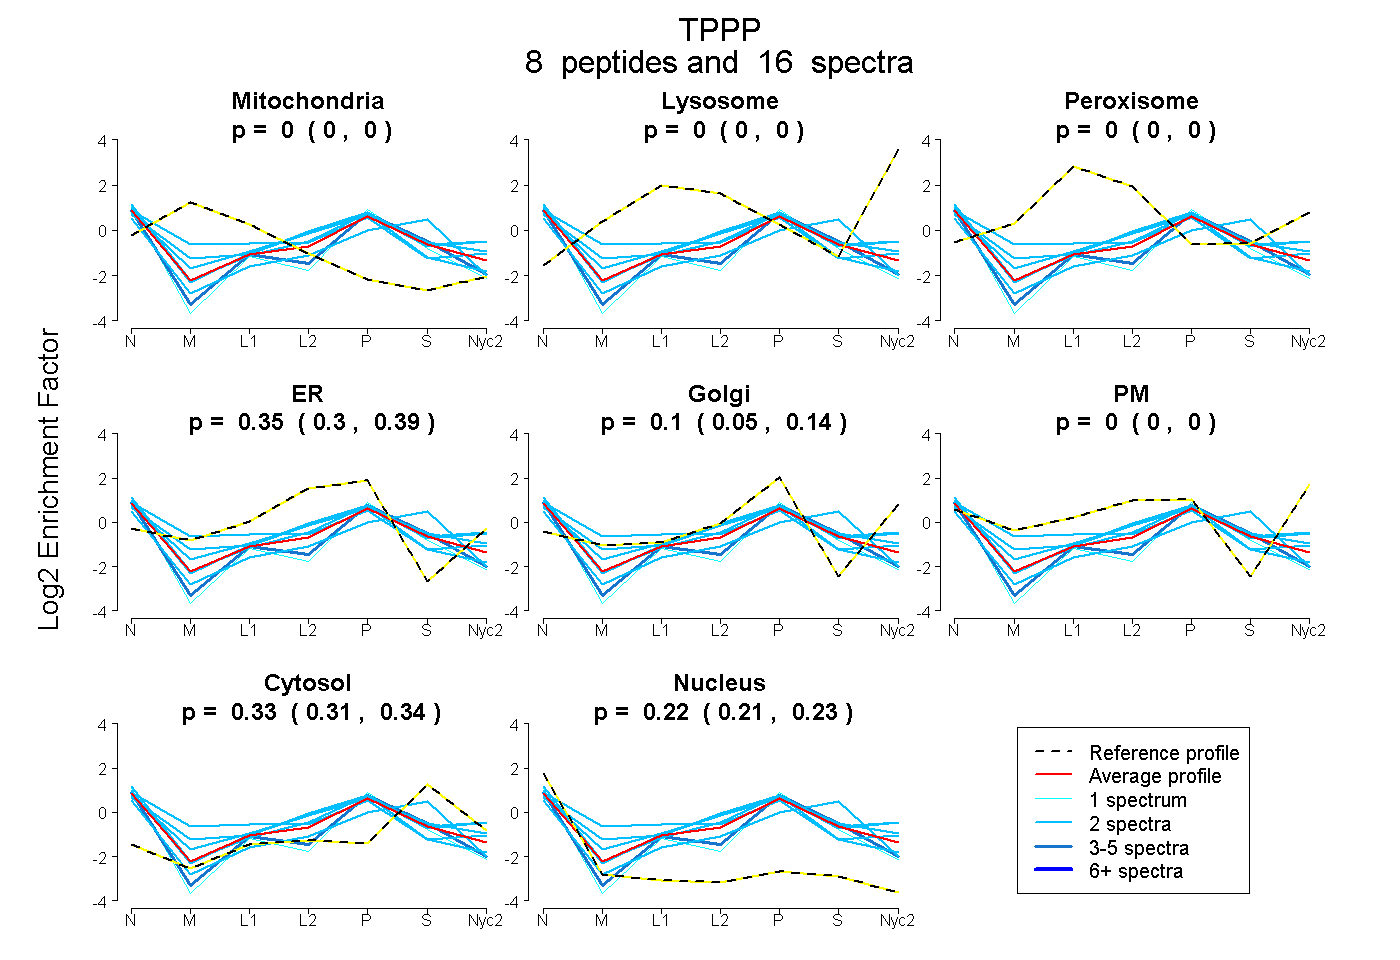
0.000 | 0.000
0.000 | 0.000
0.000 | 0.000
0.303 | 0.391
0.048 | 0.141
0.000 | 0.000
0.309 | 0.344
0.208 | 0.234
3peptides
spectra
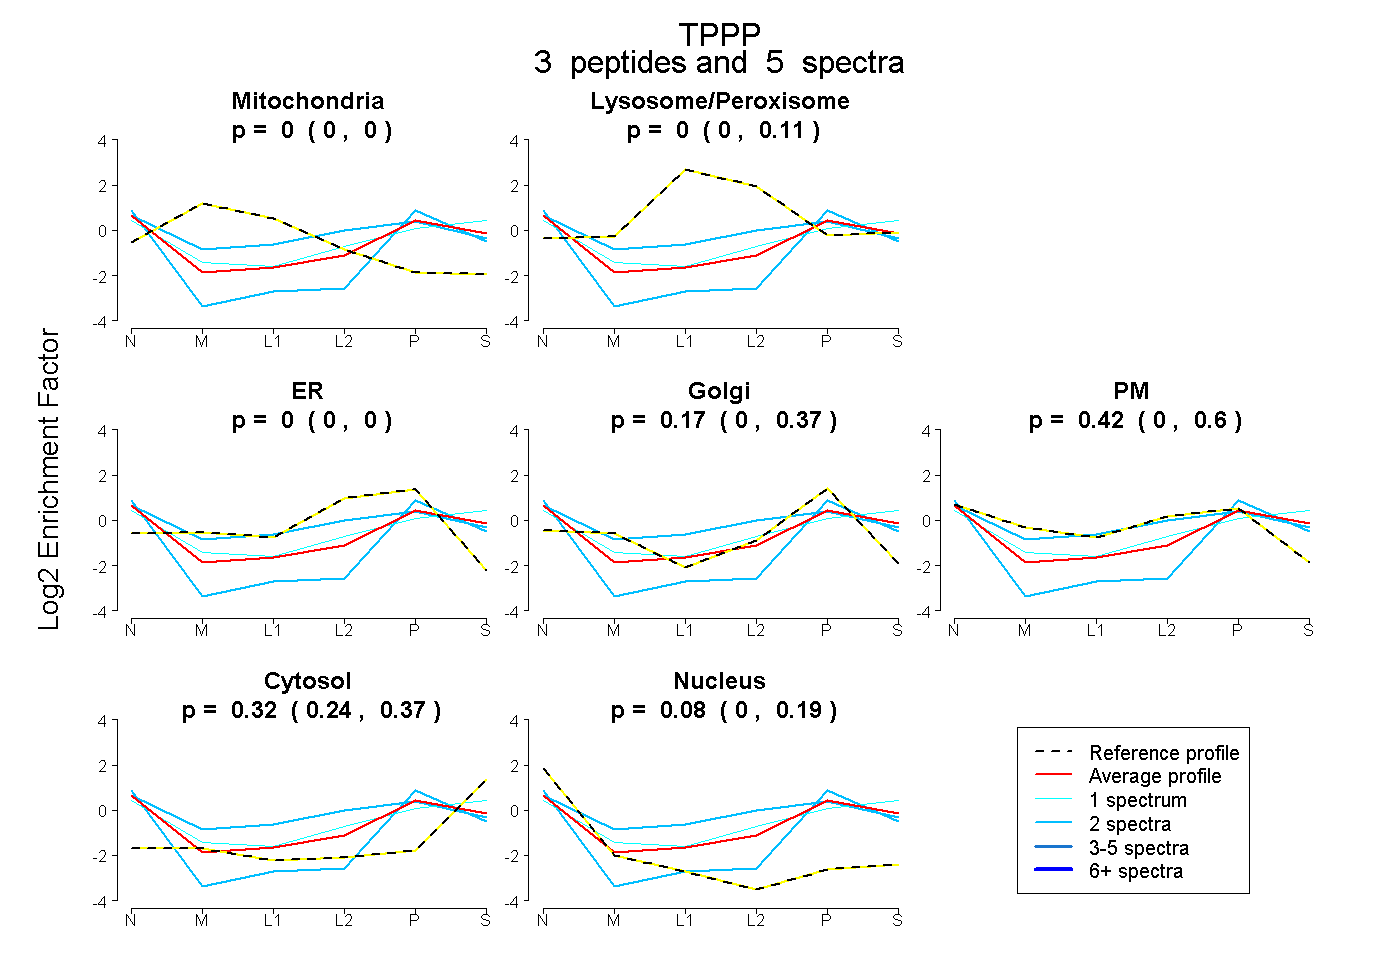
0.000 | 0.000
0.000 | 0.112
0.000 | 0.000
0.000 | 0.367
0.000 | 0.604
0.237 | 0.366
0.000 | 0.185
3peptides
spectra
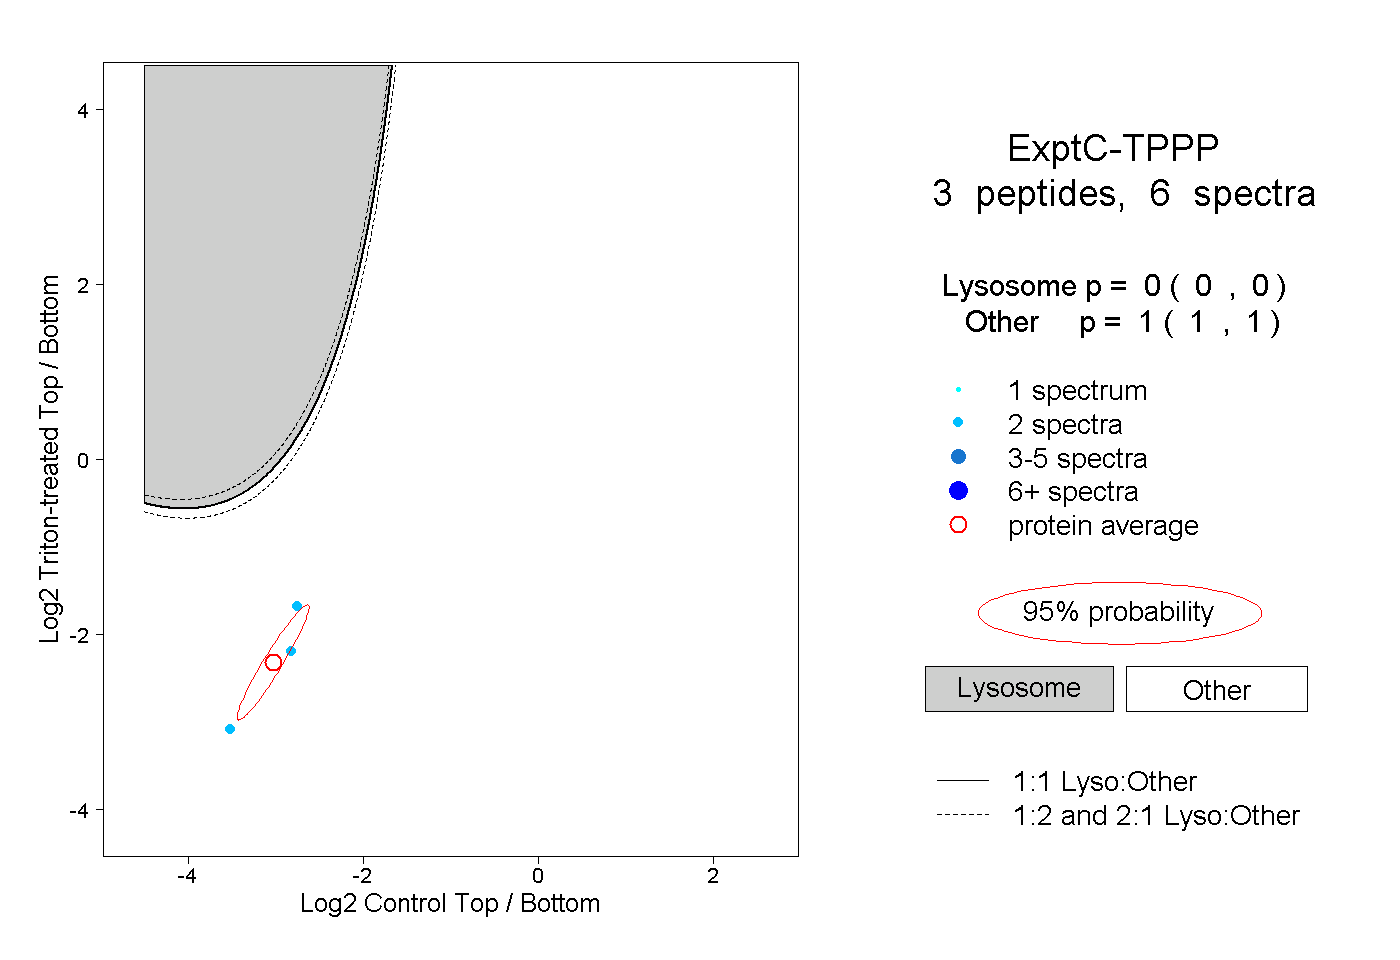
0.000 | 0.000
1.000 | 1.000