 8
8peptides
spectra
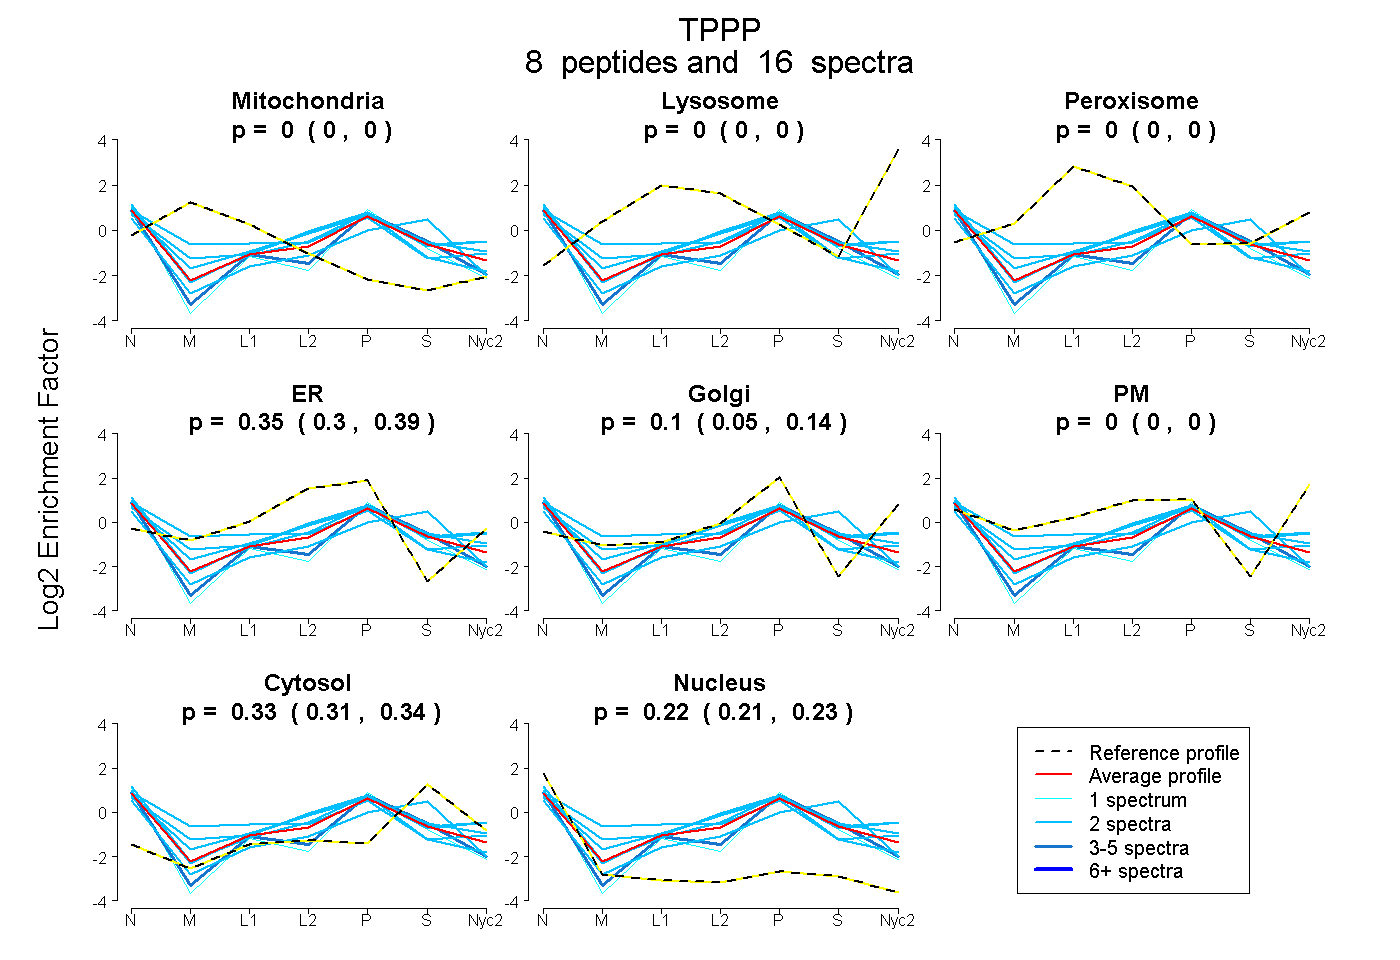
0.000 | 0.000
0.000 | 0.000
0.000 | 0.000
0.303 | 0.391
0.048 | 0.141
0.000 | 0.000
0.309 | 0.344
0.208 | 0.234
| Plot | Mito | Lyso | Perox | ER | Golgi | PM | Cytosol | Nucleus | |||||
| Expt A |
8 peptides |
16 spectra |
|
0.000 0.000 | 0.000 |
0.000 0.000 | 0.000 |
0.000 0.000 | 0.000 |
0.352 0.303 | 0.391 |
0.098 0.048 | 0.141 |
0.000 0.000 | 0.000 |
0.328 0.309 | 0.344 |
0.222 0.208 | 0.234 |
| 2 spectra, SSEEAVR | 0.000 | 0.000 | 0.000 | 0.502 | 0.000 | 0.000 | 0.186 | 0.312 | ||
| 1 spectrum, APVISGVTK | 0.000 | 0.000 | 0.000 | 0.116 | 0.224 | 0.000 | 0.289 | 0.371 | ||
| 3 spectra, AVSSPTVSR | 0.000 | 0.000 | 0.000 | 0.210 | 0.122 | 0.000 | 0.365 | 0.303 | ||
| 2 spectra, FDQSGK | 0.035 | 0.000 | 0.204 | 0.138 | 0.313 | 0.000 | 0.055 | 0.255 | ||
| 2 spectra, DCHVIDGK | 0.000 | 0.000 | 0.000 | 0.185 | 0.000 | 0.000 | 0.588 | 0.227 | ||
| 2 spectra, FAVHGDTR | 0.000 | 0.000 | 0.000 | 0.260 | 0.079 | 0.243 | 0.313 | 0.105 | ||
| 2 spectra, TITFEQFQEALEELAK | 0.000 | 0.000 | 0.000 | 0.383 | 0.000 | 0.127 | 0.346 | 0.144 | ||
| 2 spectra, NVTVTDVDIVFSK | 0.000 | 0.000 | 0.000 | 0.227 | 0.088 | 0.220 | 0.312 | 0.153 |
| Plot | Mito | Lyso or Perox | ER | Golgi | PM | Cytosol | Nucleus | ||||||
| Expt B |
3 peptides |
5 spectra |
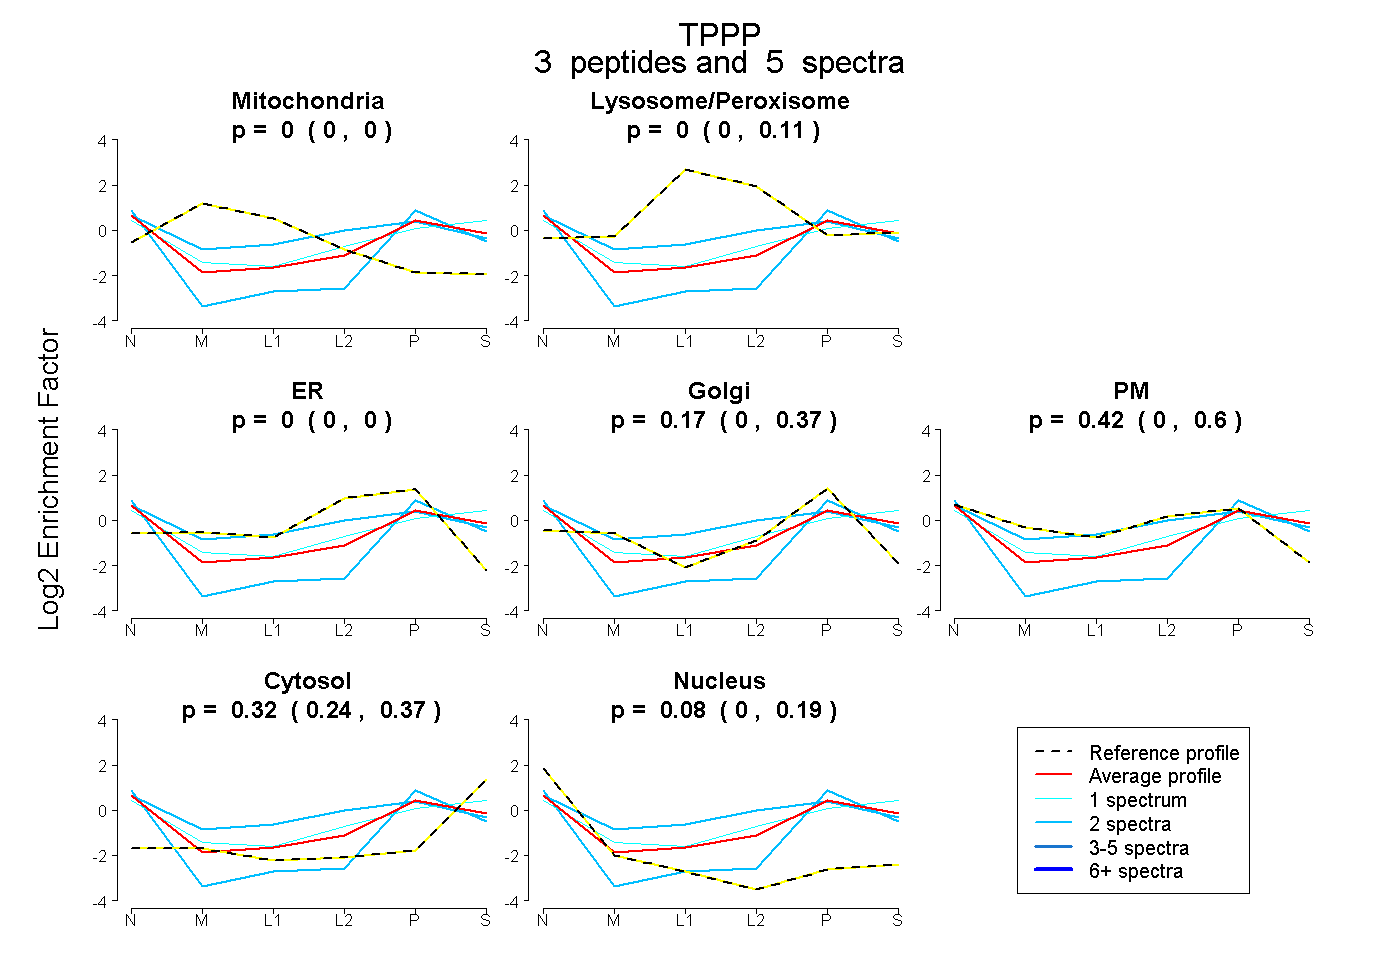 |
0.000 0.000 | 0.000 |
0.000 0.000 | 0.112 |
0.000 0.000 | 0.000 |
0.170 0.000 | 0.367 |
0.424 0.000 | 0.604 |
0.325 0.237 | 0.366 |
0.081 0.000 | 0.185 |
|||
| Plot | Lyso | Other | |||||||||||
| Expt C |
3 peptides |
6 spectra |
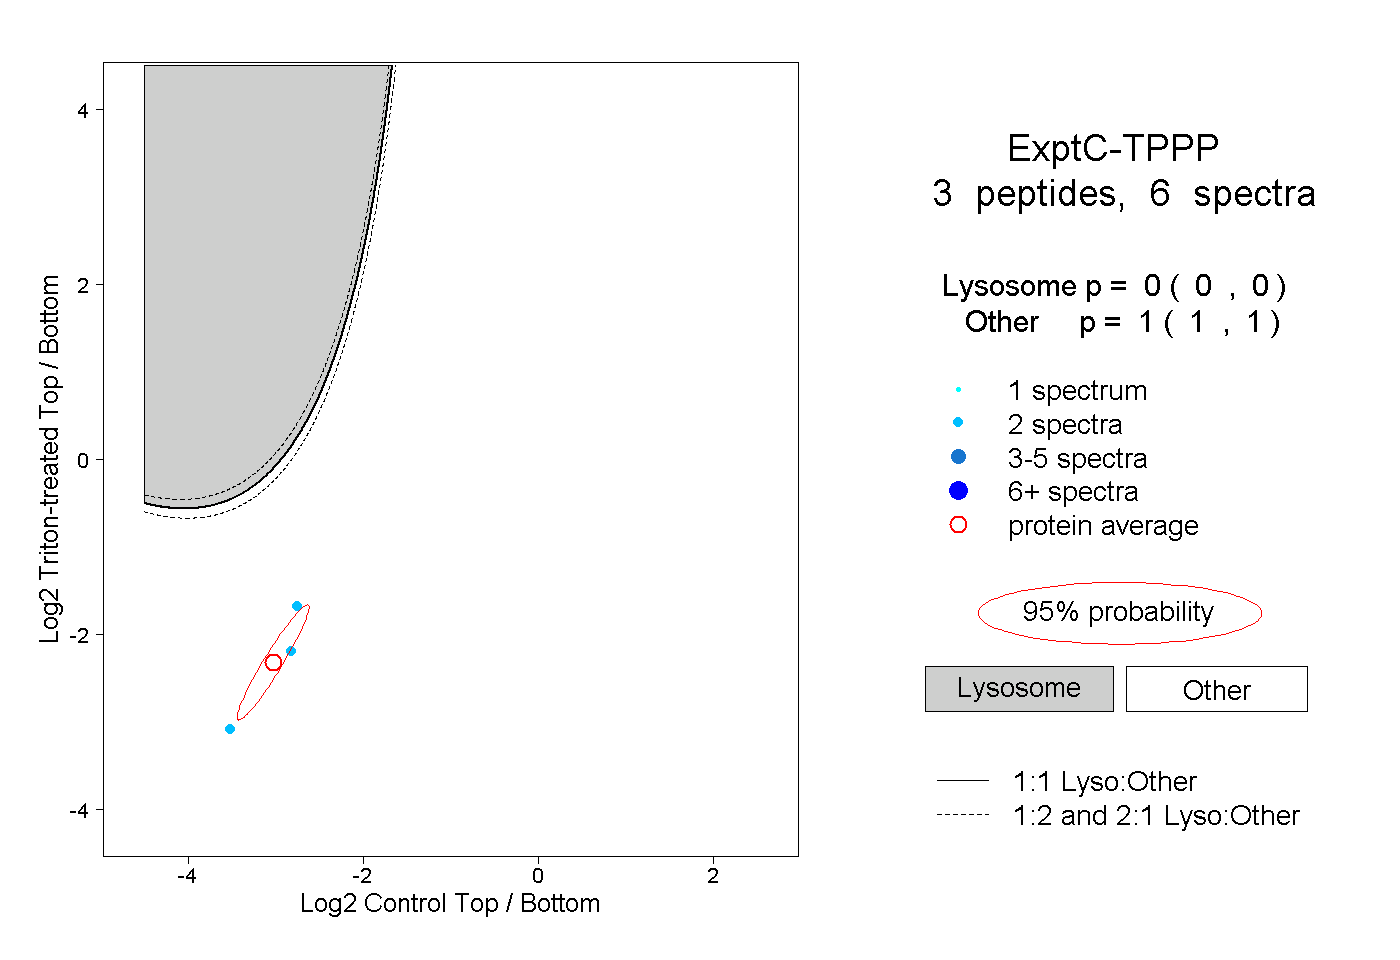 |
0.000 0.000 | 0.000 |
1.000 1.000 | 1.000 |