 6
6peptides
spectra
0.000 | 0.000
0.000 | 0.000
0.000 | 0.020
0.000 | 0.029
0.000 | 0.087
0.715 | 0.802
0.162 | 0.206
0.000 | 0.000
1peptide
spectra
NA | NA
NA | NA
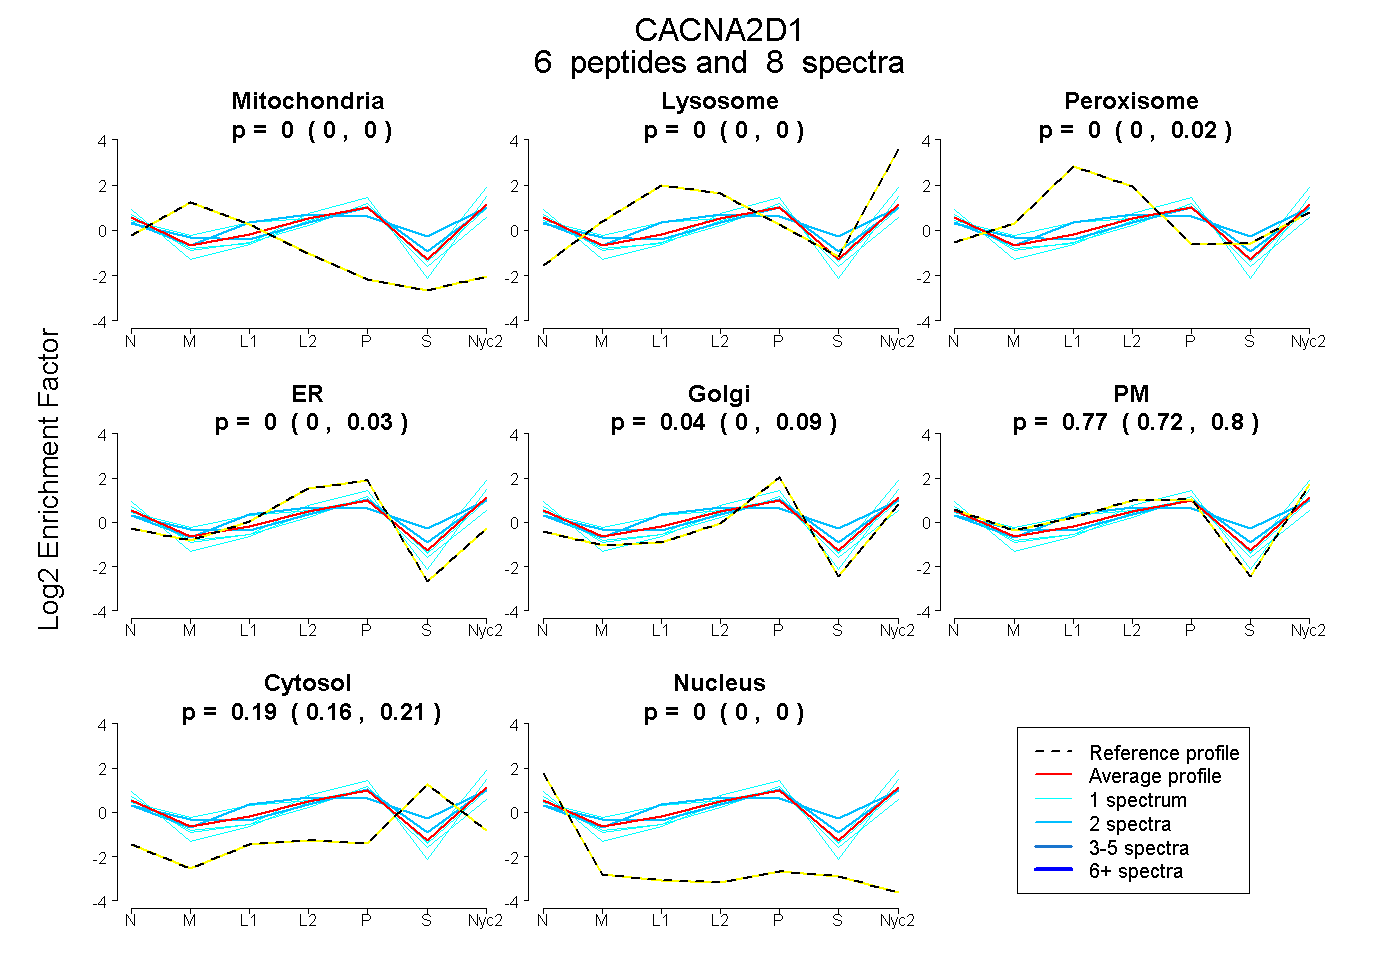
| Plot | Mito | Lyso | Perox | ER | Golgi | PM | Cytosol | Nucleus | |||||
| Expt A |
6 peptides |
8 spectra |
|
0.000 0.000 | 0.000 |
0.000 0.000 | 0.000 |
0.000 0.000 | 0.020 |
0.000 0.000 | 0.029 |
0.041 0.000 | 0.087 |
0.771 0.715 | 0.802 |
0.187 0.162 | 0.206 |
0.000 0.000 | 0.000 |
||
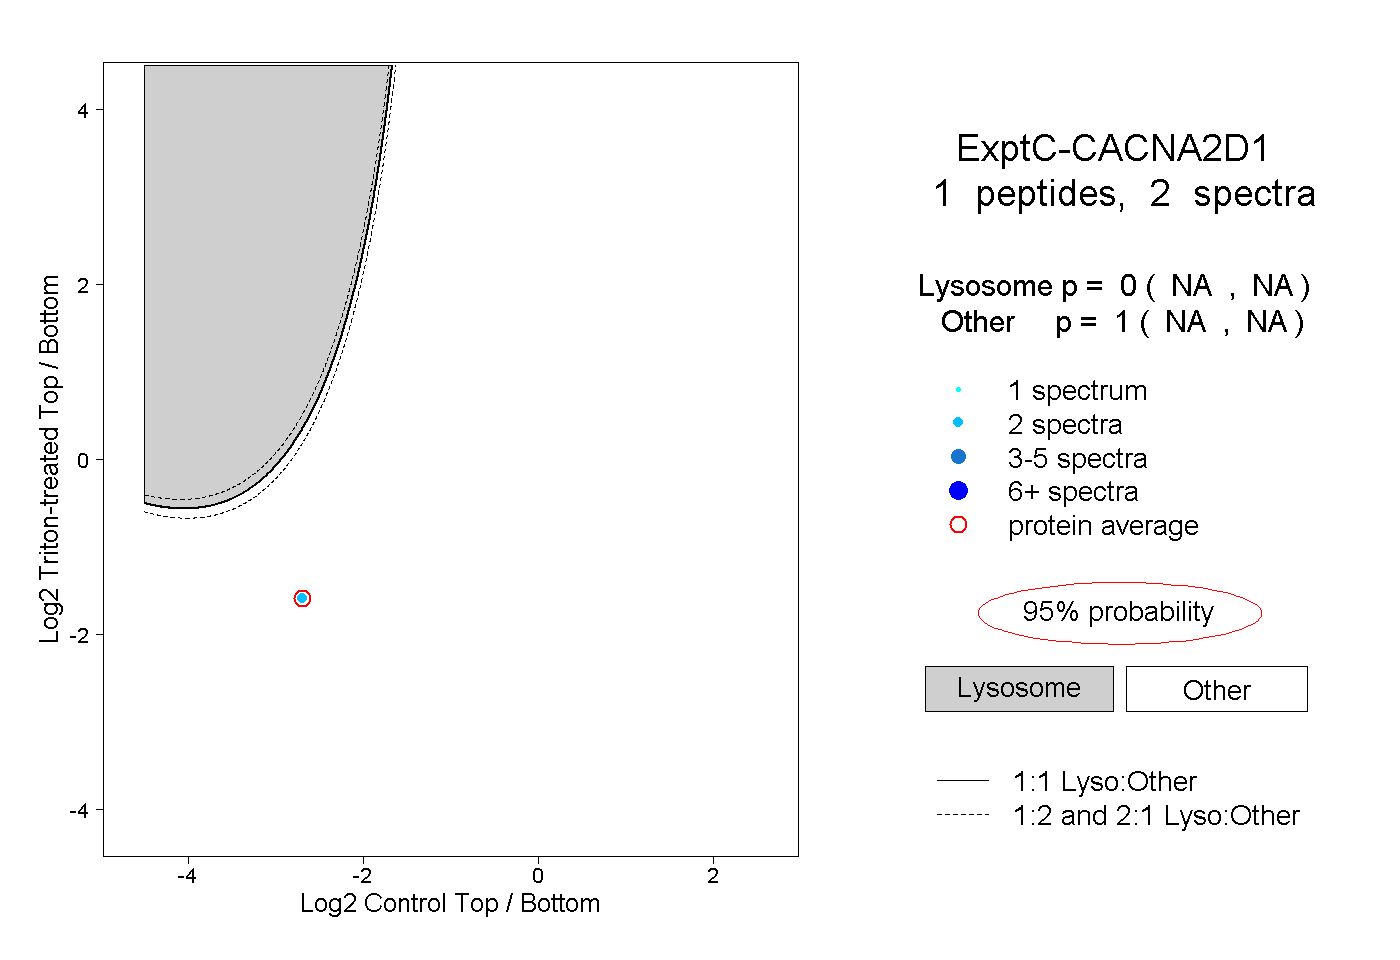
| Plot | Lyso | Other | |||||||||||
| Expt C |
1 peptide |
2 spectra |
|
0.000 NA | NA |
1.000 NA | NA |