 6
6peptides
spectra
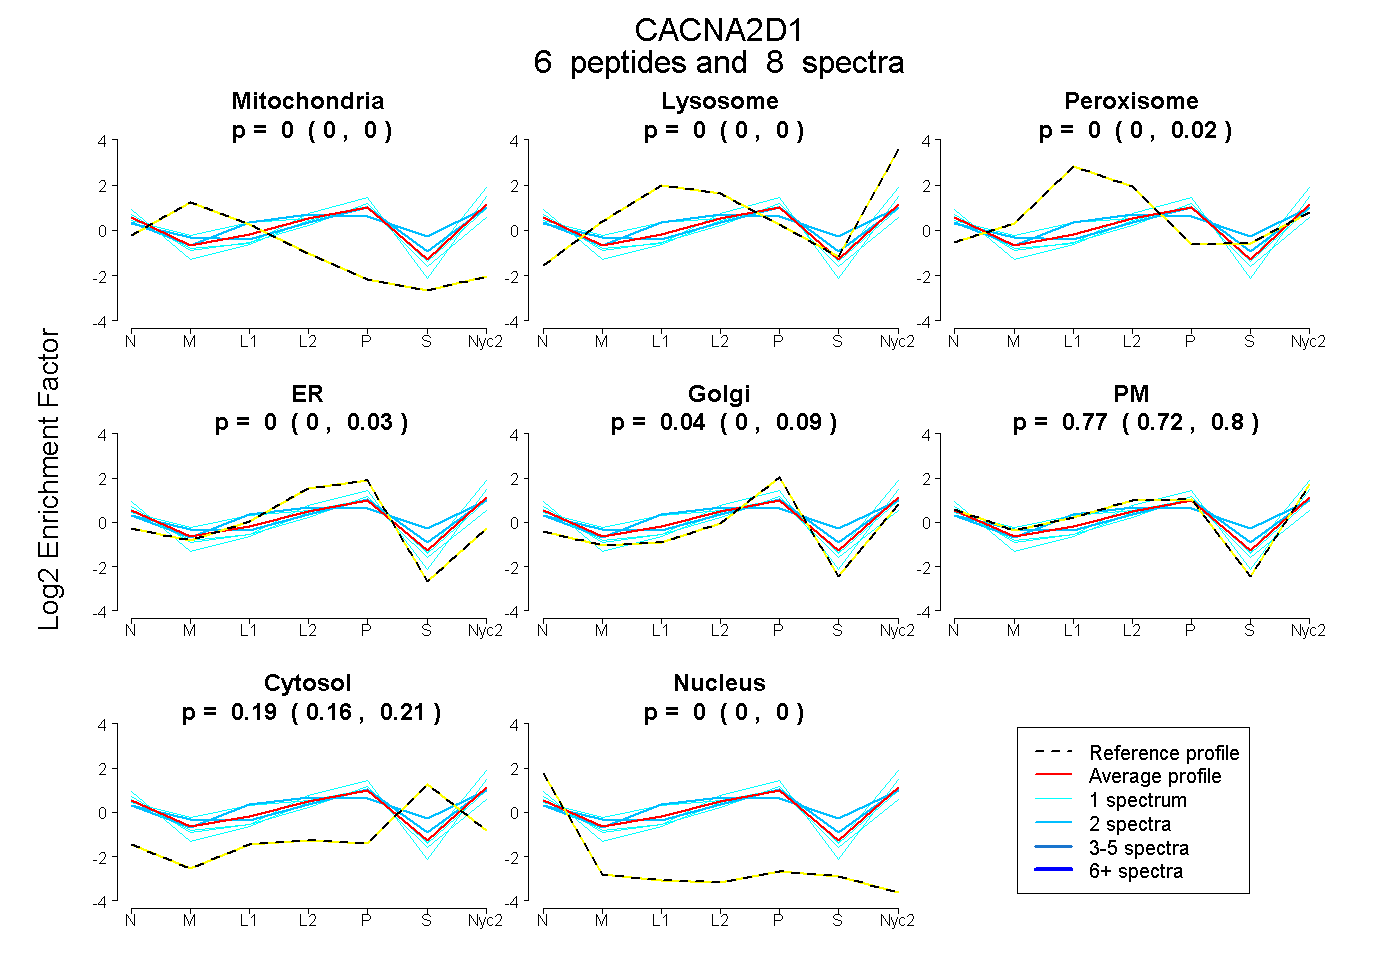
0.000 | 0.000
0.000 | 0.000
0.000 | 0.020
0.000 | 0.029
0.000 | 0.087
0.715 | 0.802
0.162 | 0.206
0.000 | 0.000
| Plot | Mito | Lyso | Perox | ER | Golgi | PM | Cytosol | Nucleus | |||||
| Expt A |
6 peptides |
8 spectra |
|
0.000 0.000 | 0.000 |
0.000 0.000 | 0.000 |
0.000 0.000 | 0.020 |
0.000 0.000 | 0.029 |
0.041 0.000 | 0.087 |
0.771 0.715 | 0.802 |
0.187 0.162 | 0.206 |
0.000 0.000 | 0.000 |
| 1 spectrum, LLKPAVVGIK | 0.000 | 0.149 | 0.000 | 0.000 | 0.000 | 0.750 | 0.101 | 0.000 | ||
| 2 spectra, VQAAHQWR | 0.000 | 0.000 | 0.039 | 0.000 | 0.130 | 0.619 | 0.211 | 0.000 | ||
| 1 spectrum, FVVTDGGITR | 0.000 | 0.000 | 0.000 | 0.000 | 0.218 | 0.601 | 0.158 | 0.022 | ||
| 1 spectrum, QLVEIAAR | 0.000 | 0.000 | 0.000 | 0.107 | 0.120 | 0.563 | 0.121 | 0.090 | ||
| 1 spectrum, IIMLFTDGGEER | 0.000 | 0.000 | 0.000 | 0.000 | 0.318 | 0.657 | 0.022 | 0.003 | ||
| 2 spectra, MIDGESGEK | 0.000 | 0.000 | 0.222 | 0.000 | 0.000 | 0.525 | 0.253 | 0.000 |
| Plot | Lyso | Other | |||||||||||
| Expt C |
1 peptide |
2 spectra |
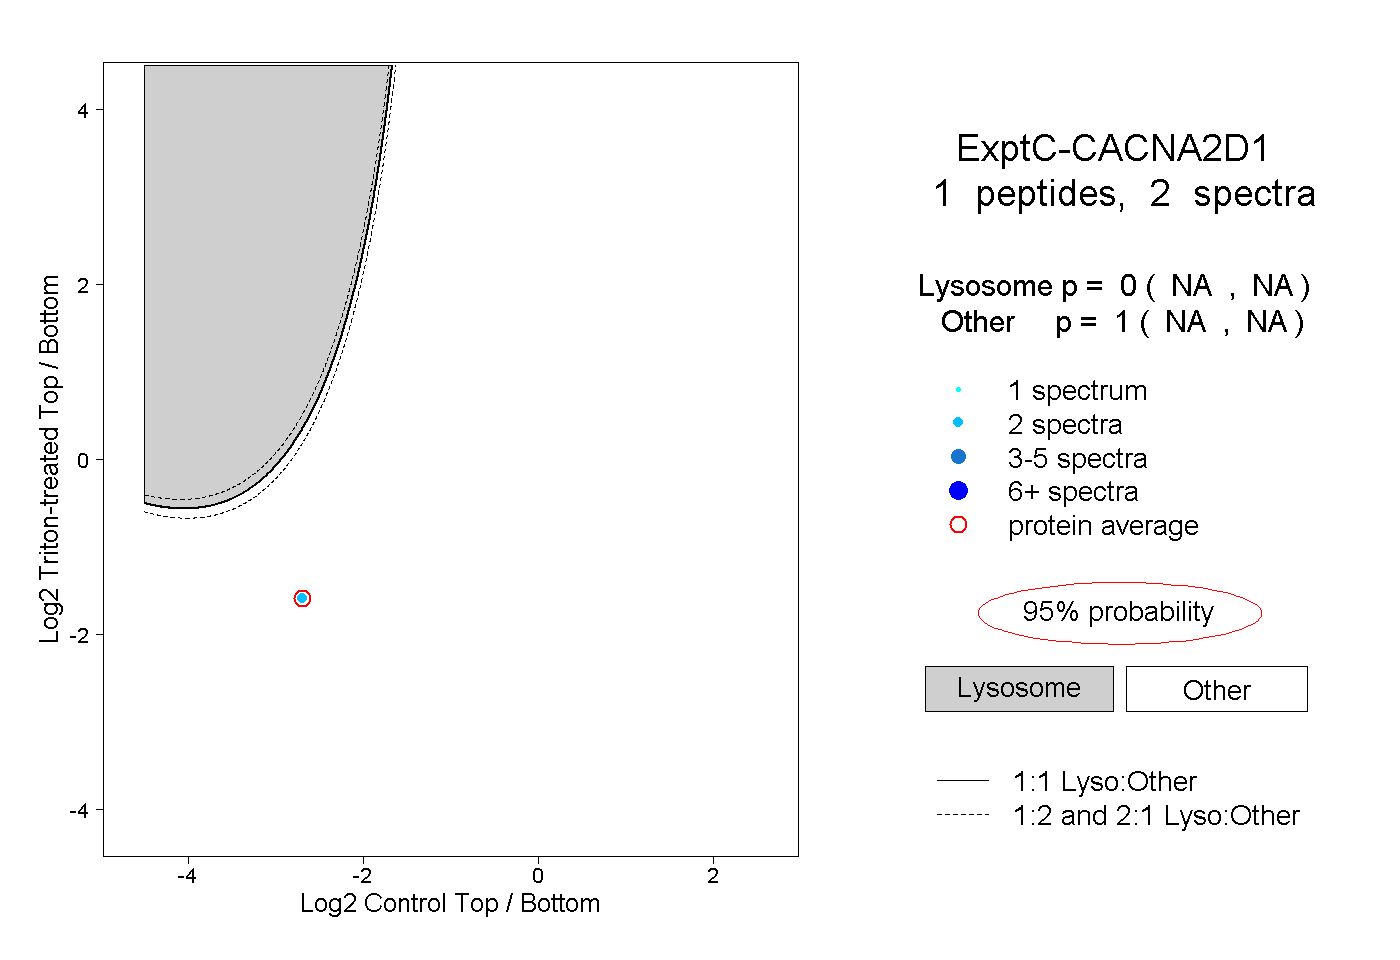 |
0.000 NA | NA |
1.000 NA | NA |