 5
5peptides
spectra
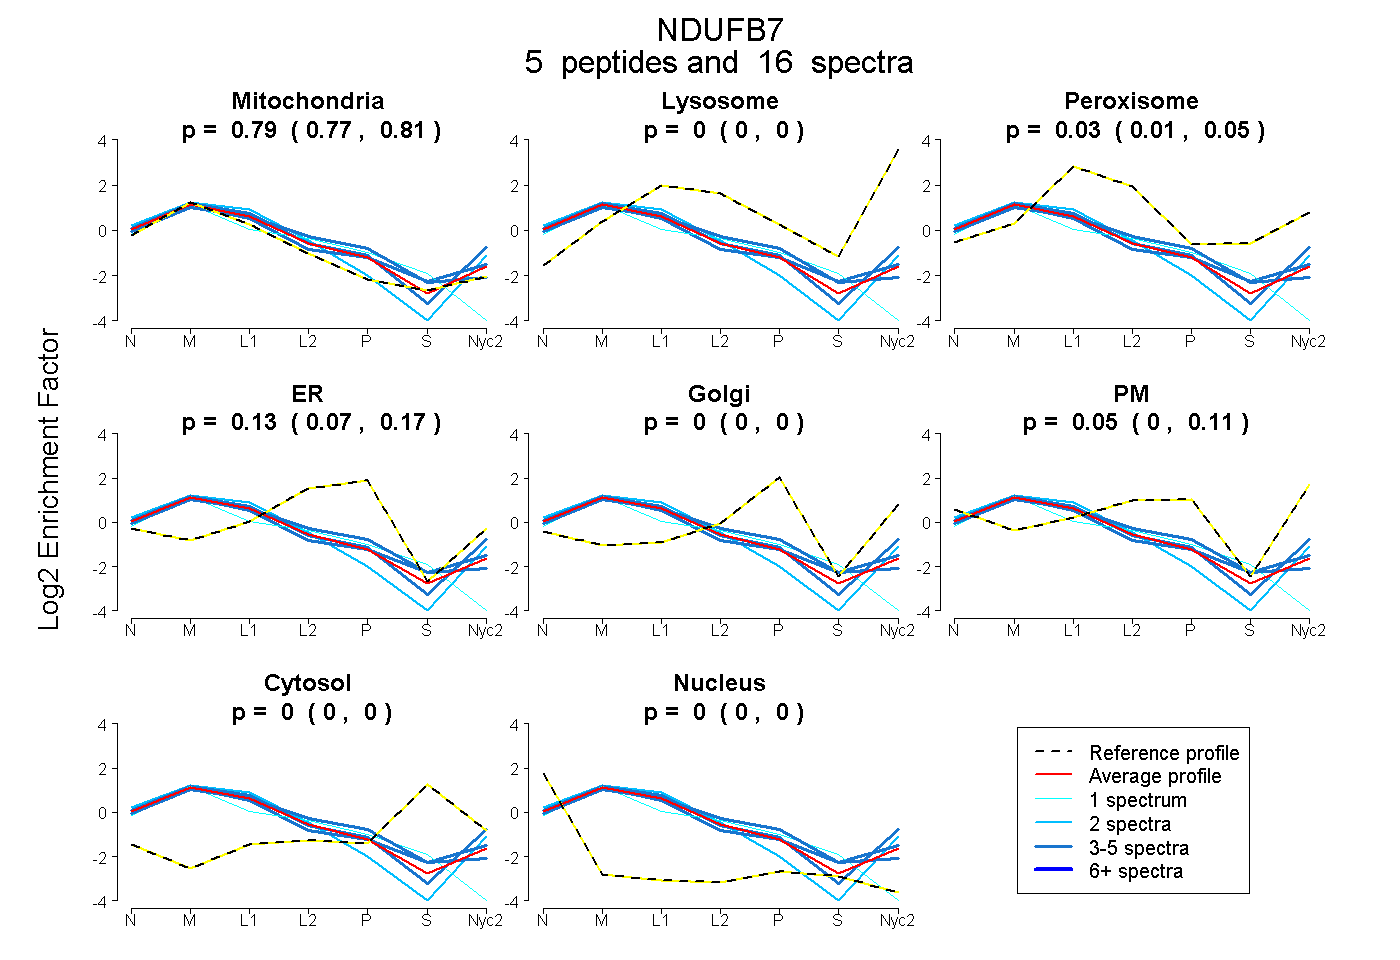
0.765 | 0.805
0.000 | 0.000
0.007 | 0.052
0.072 | 0.173
0.000 | 0.000
0.000 | 0.114
0.000 | 0.000
0.000 | 0.000
3peptides
spectra
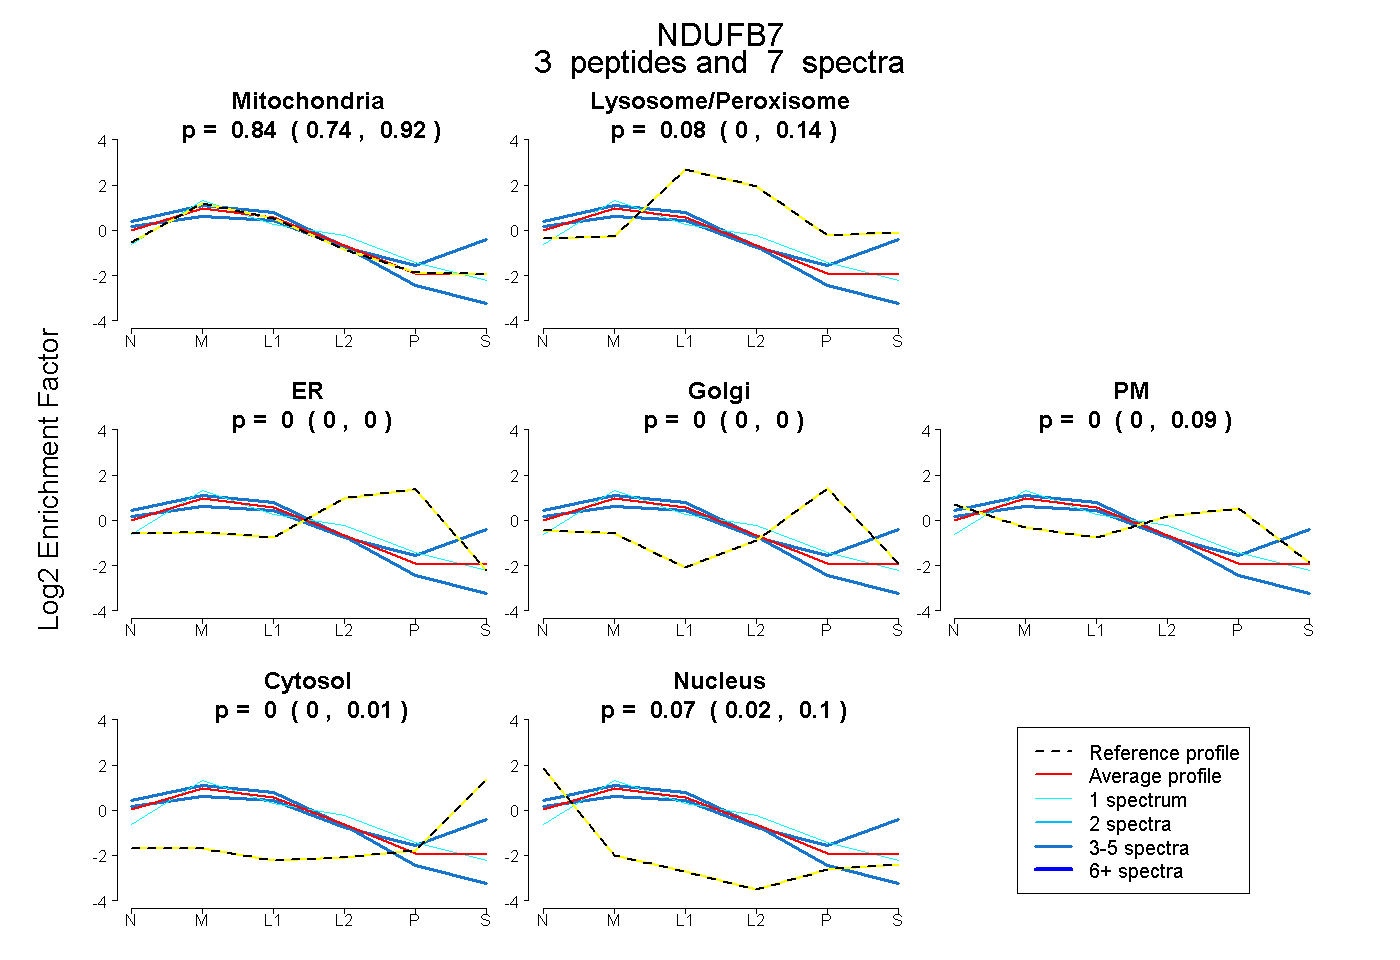
0.739 | 0.916
0.000 | 0.141
0.000 | 0.000
0.000 | 0.000
0.000 | 0.094
0.000 | 0.010
0.017 | 0.098
5peptides
spectra
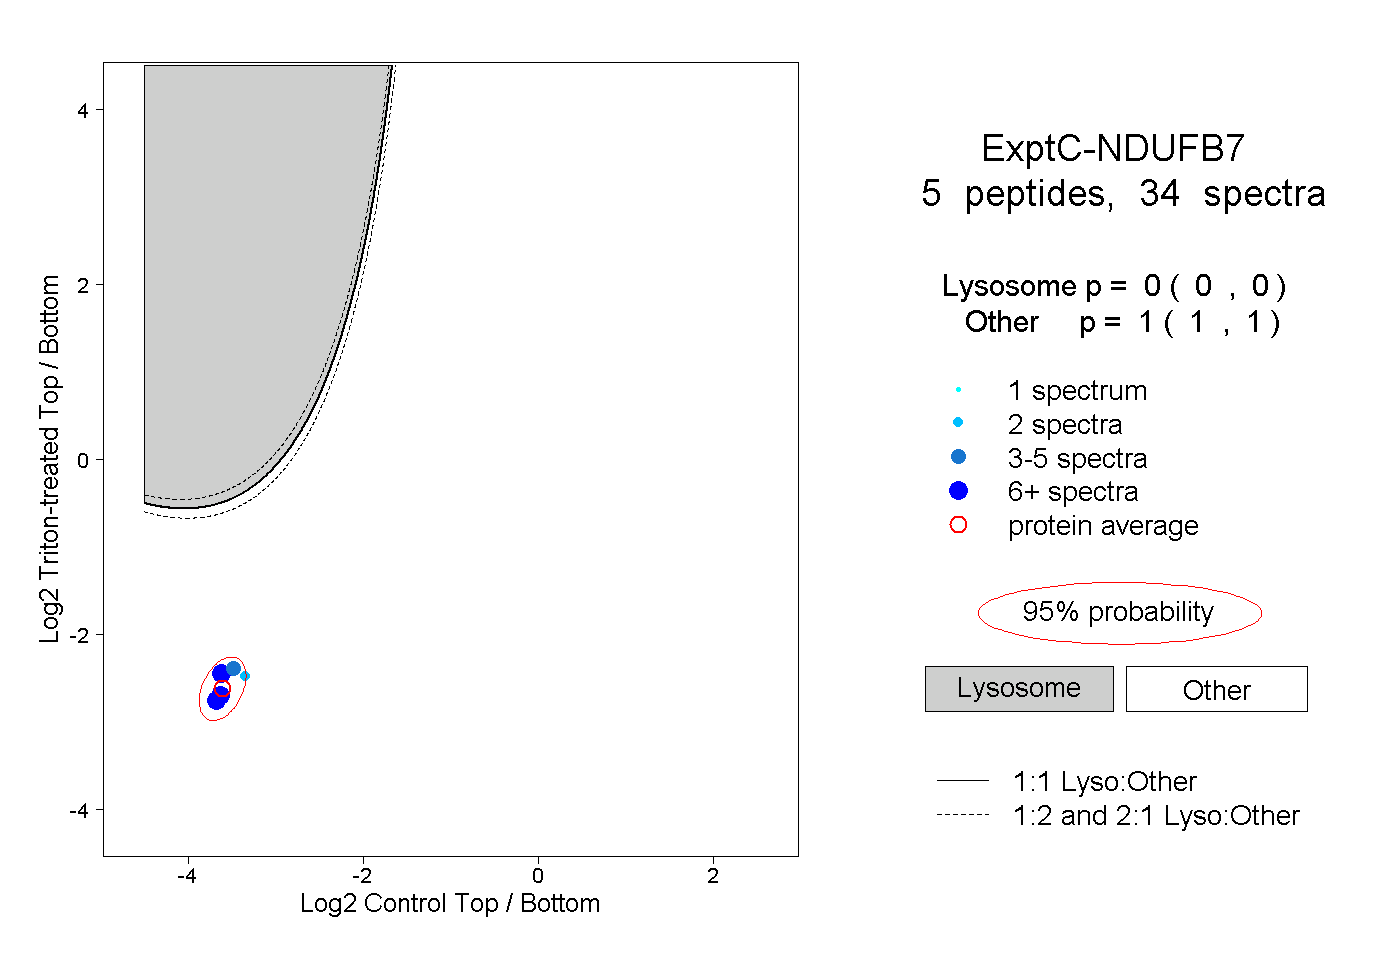
0.000 | 0.000
1.000 | 1.000
5peptides
spectra
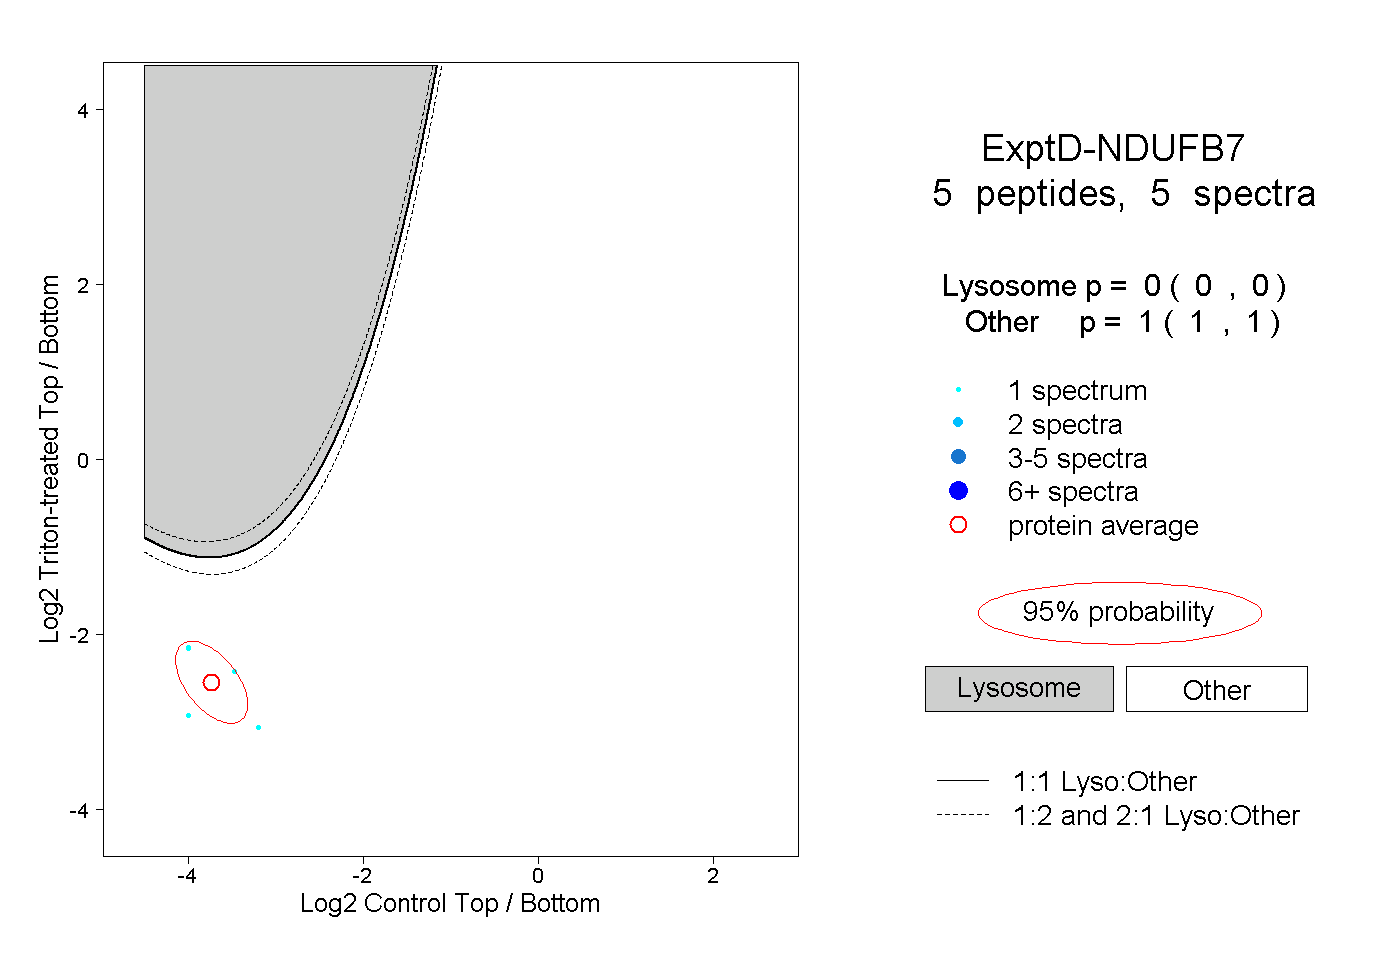
0.000 | 0.000
1.000 | 1.000