 5
5peptides
spectra
0.765 | 0.805
0.000 | 0.000
0.007 | 0.052
0.072 | 0.173
0.000 | 0.000
0.000 | 0.114
0.000 | 0.000
0.000 | 0.000
| Plot | Mito | Lyso | Perox | ER | Golgi | PM | Cytosol | Nucleus | |||||
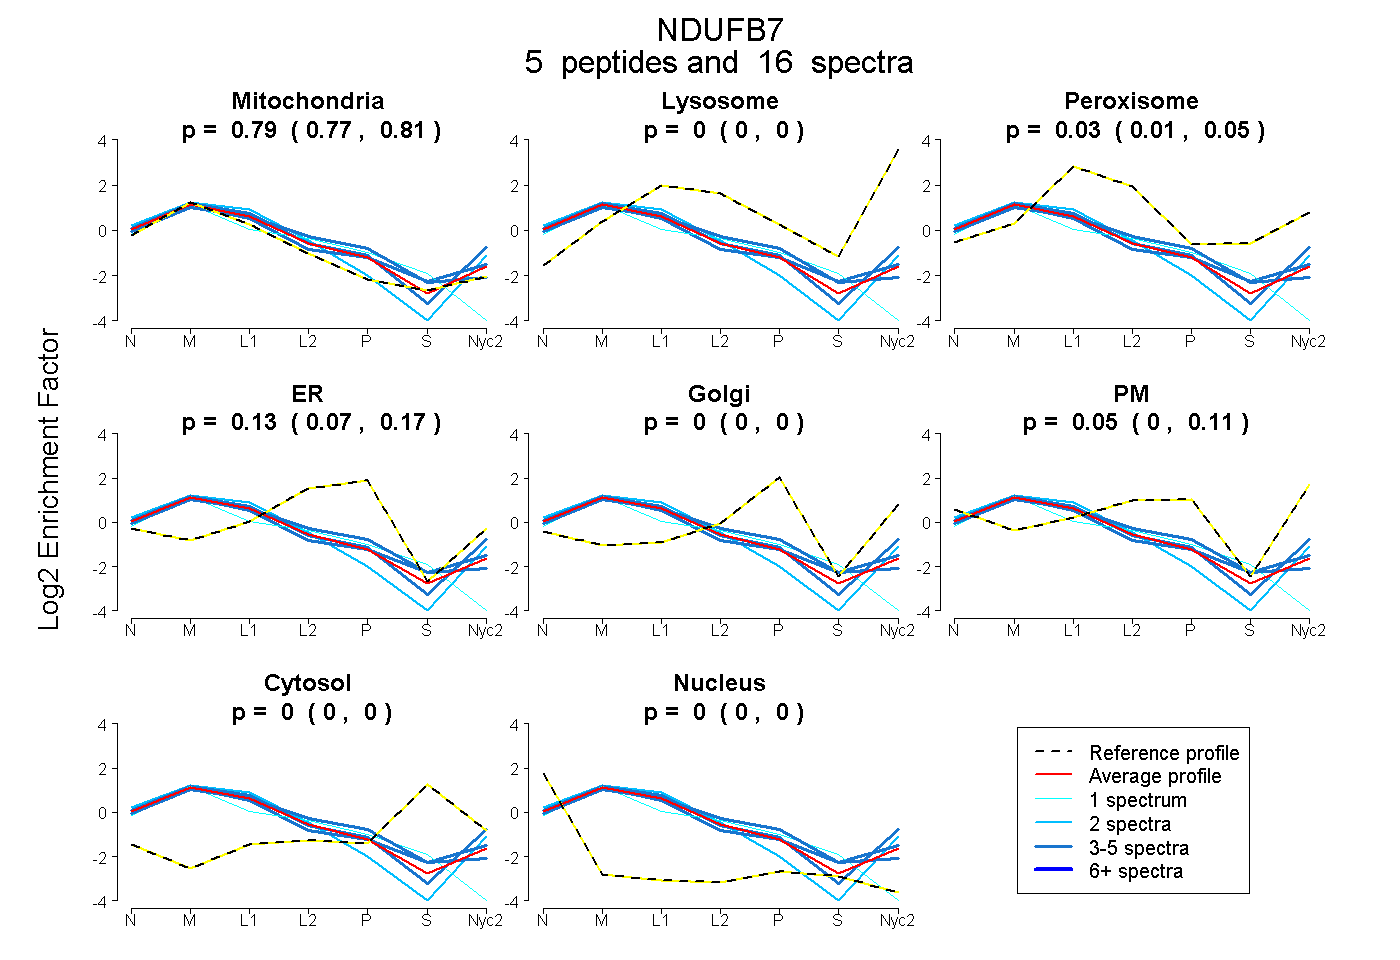
| Expt A |
5 peptides |
16 spectra |
|
0.786 0.765 | 0.805 |
0.000 0.000 | 0.000 |
0.032 0.007 | 0.052 |
0.131 0.072 | 0.173 |
0.000 0.000 | 0.000 |
0.050 0.000 | 0.114 |
0.000 0.000 | 0.000 |
0.000 0.000 | 0.000 |
| 1 spectrum, VAQGQGEGEVGPEMAL | 0.824 | 0.000 | 0.000 | 0.114 | 0.000 | 0.000 | 0.000 | 0.062 | ||
| 5 spectra, DYCAHYLIR | 0.778 | 0.000 | 0.097 | 0.000 | 0.125 | 0.000 | 0.000 | 0.000 | ||
| 2 spectra, DSFPNFVACK | 0.832 | 0.000 | 0.000 | 0.000 | 0.000 | 0.168 | 0.000 | 0.000 | ||
| 3 spectra, YLWDASVEPDPEK | 0.726 | 0.000 | 0.049 | 0.225 | 0.000 | 0.000 | 0.000 | 0.000 | ||
| 5 spectra, MPSFPPNYGLPER | 0.708 | 0.023 | 0.000 | 0.000 | 0.000 | 0.269 | 0.000 | 0.000 |
| Plot | Mito | Lyso or Perox | ER | Golgi | PM | Cytosol | Nucleus | ||||||
| Expt B |
3 peptides |
7 spectra |
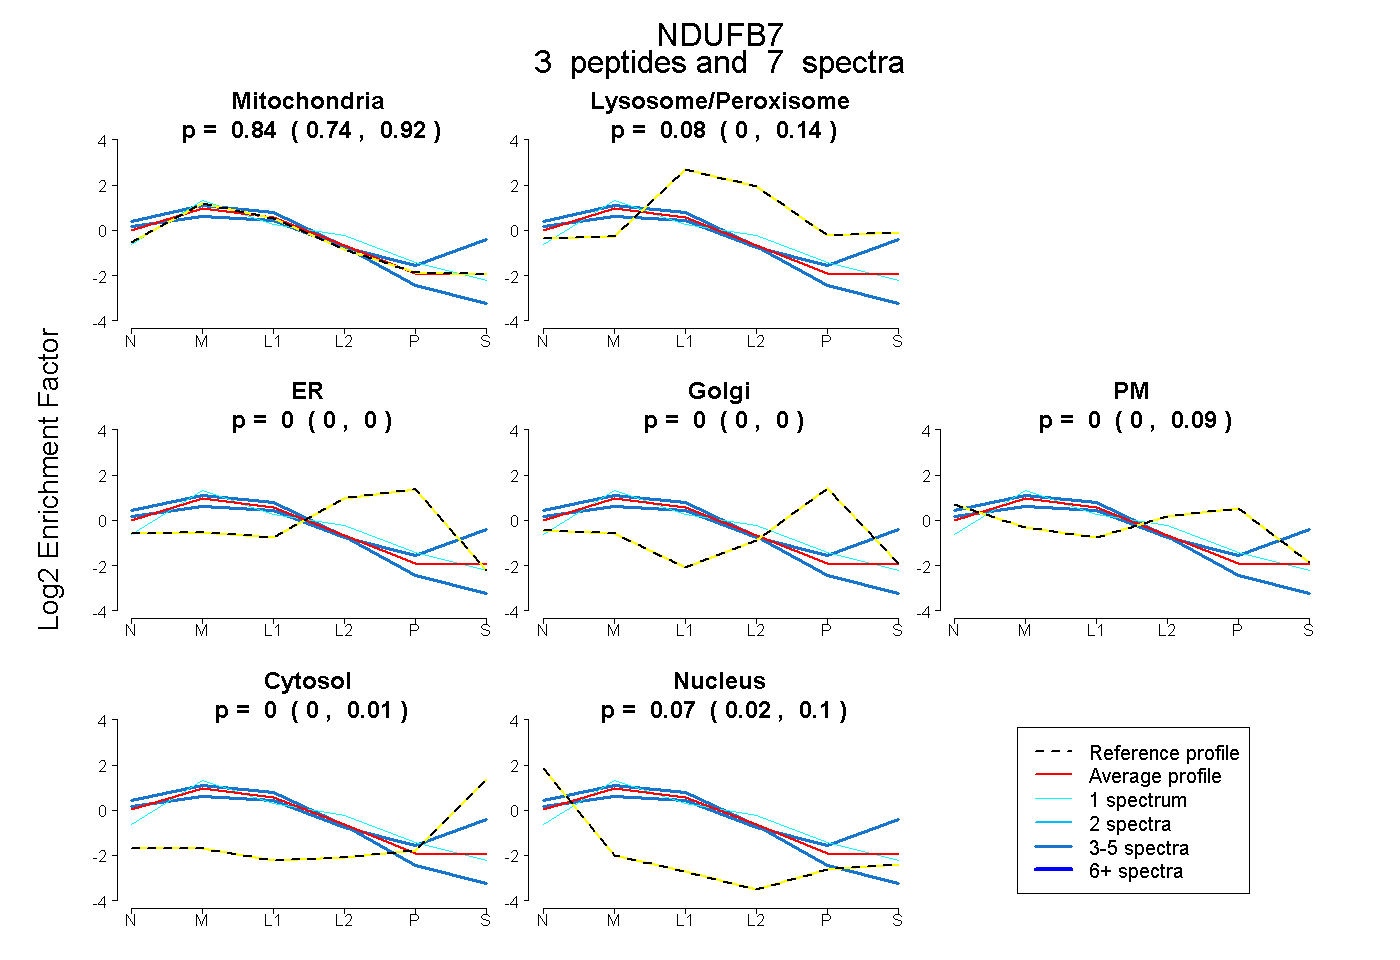 |
0.843 0.739 | 0.916 |
0.084 0.000 | 0.141 |
0.000 0.000 | 0.000 |
0.000 0.000 | 0.000 |
0.000 0.000 | 0.094 |
0.000 0.000 | 0.010 |
0.073 0.017 | 0.098 |
|||
| Plot | Lyso | Other | |||||||||||
| Expt C |
5 peptides |
34 spectra |
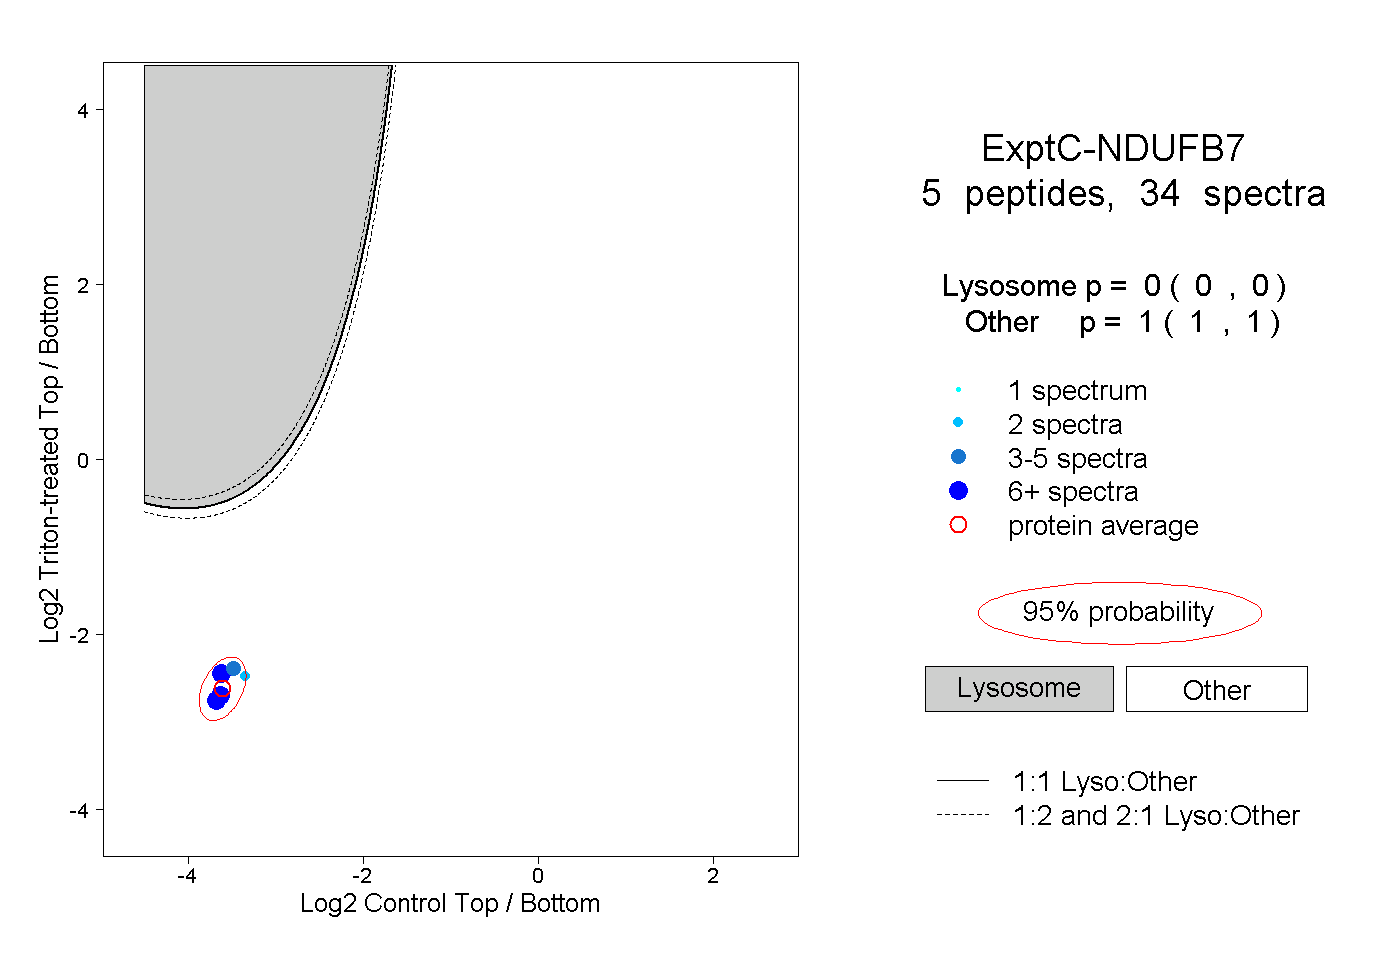 |
0.000 0.000 | 0.000 |
1.000 1.000 | 1.000 |
||||||||
| Plot | Lyso | Other | |||||||||||
| Expt D |
5 peptides |
5 spectra |
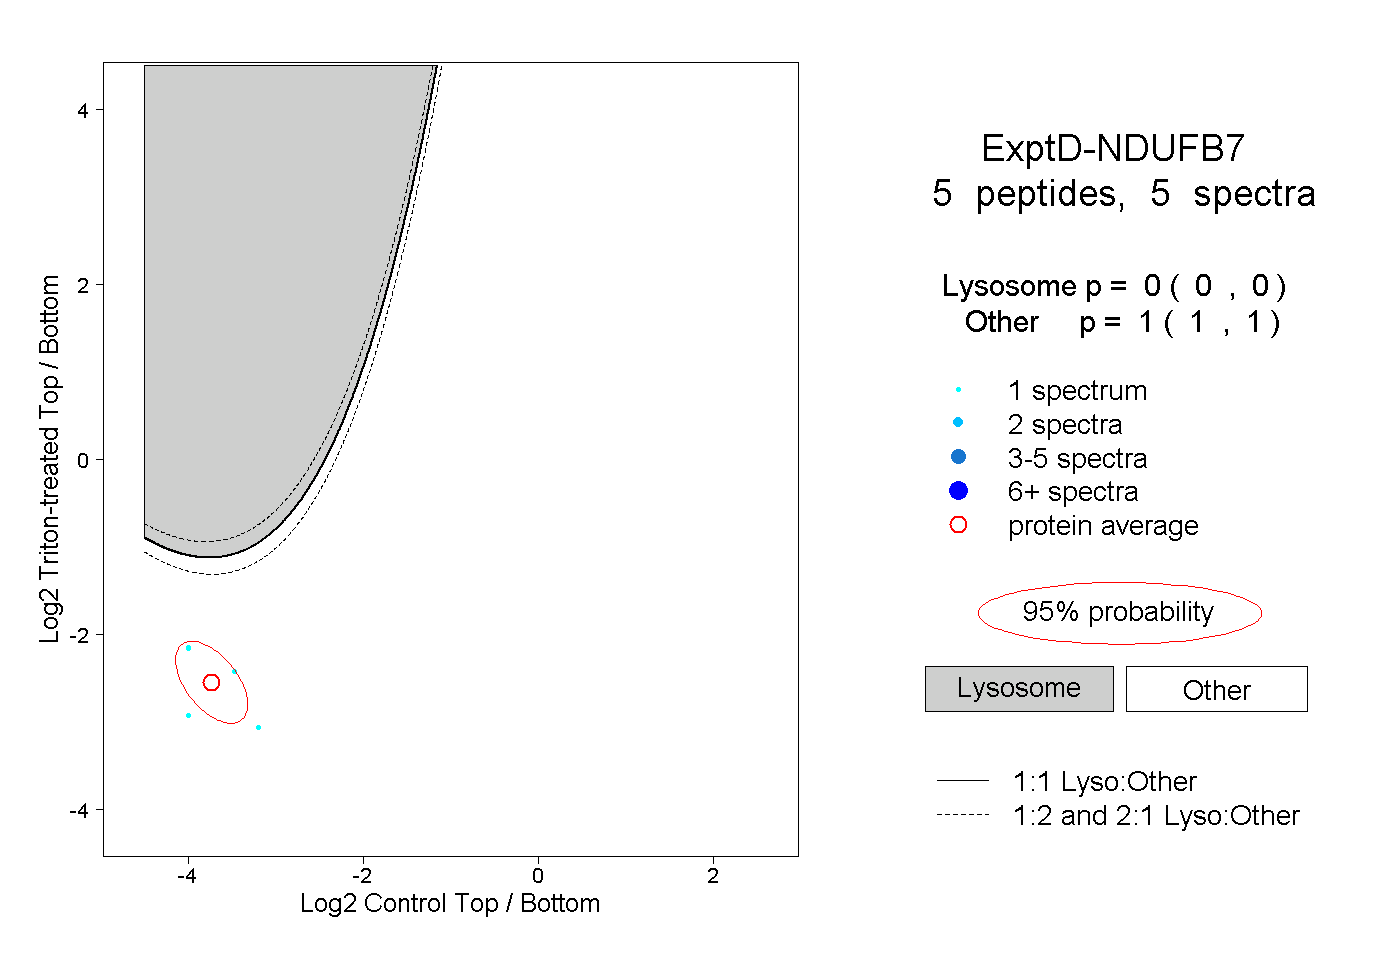 |
0.000 0.000 | 0.000 |
1.000 1.000 | 1.000 |