 10
10peptides
spectra
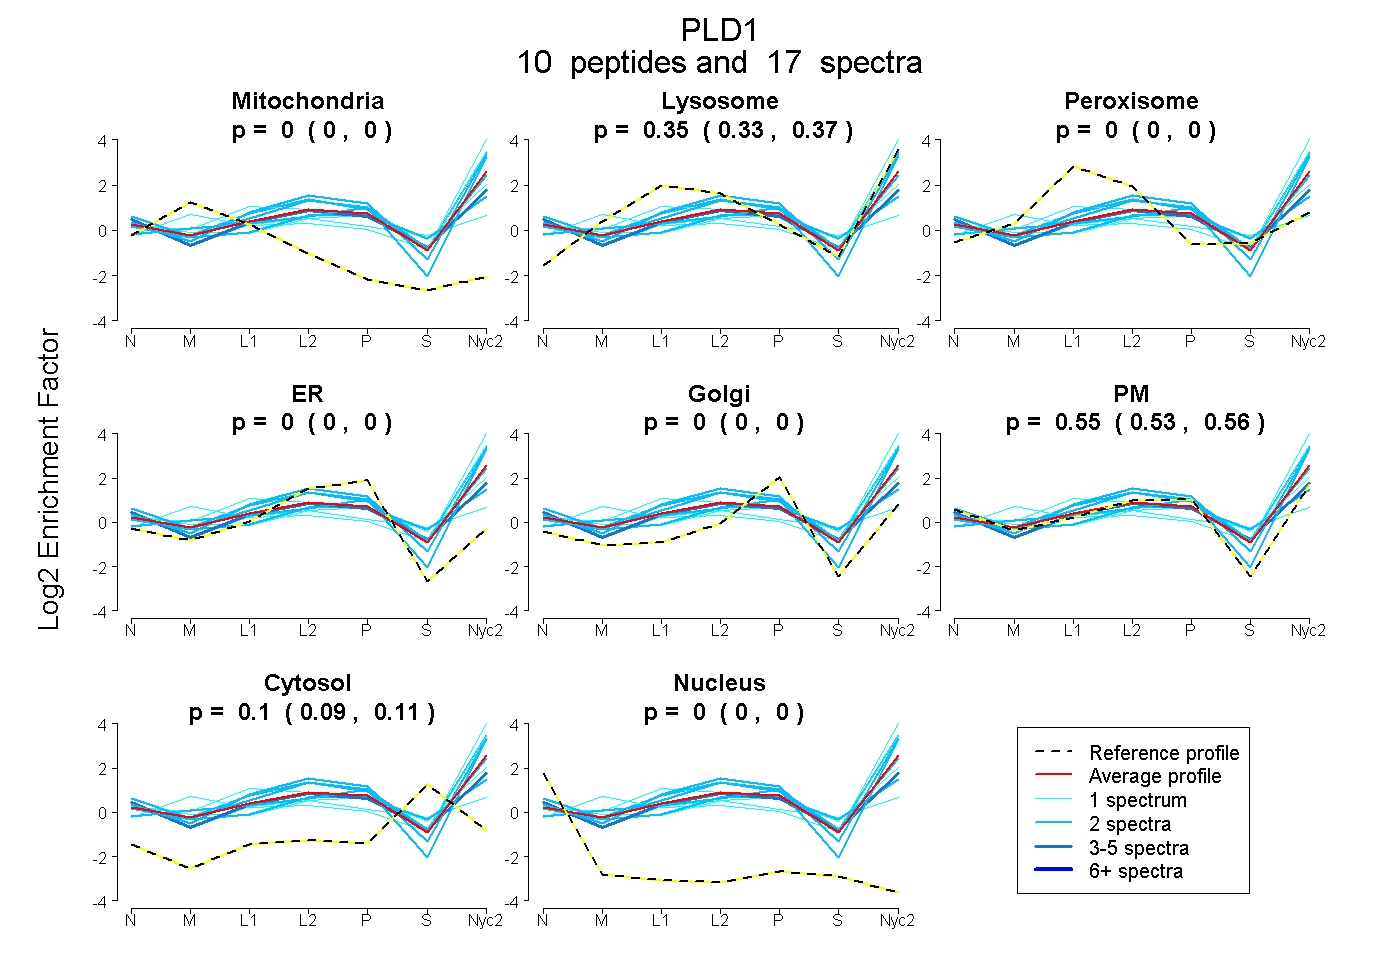
0.000 | 0.000
0.328 | 0.371
0.000 | 0.000
0.000 | 0.000
0.000 | 0.000
0.526 | 0.565
0.089 | 0.114
0.000 | 0.000
2peptides
spectra
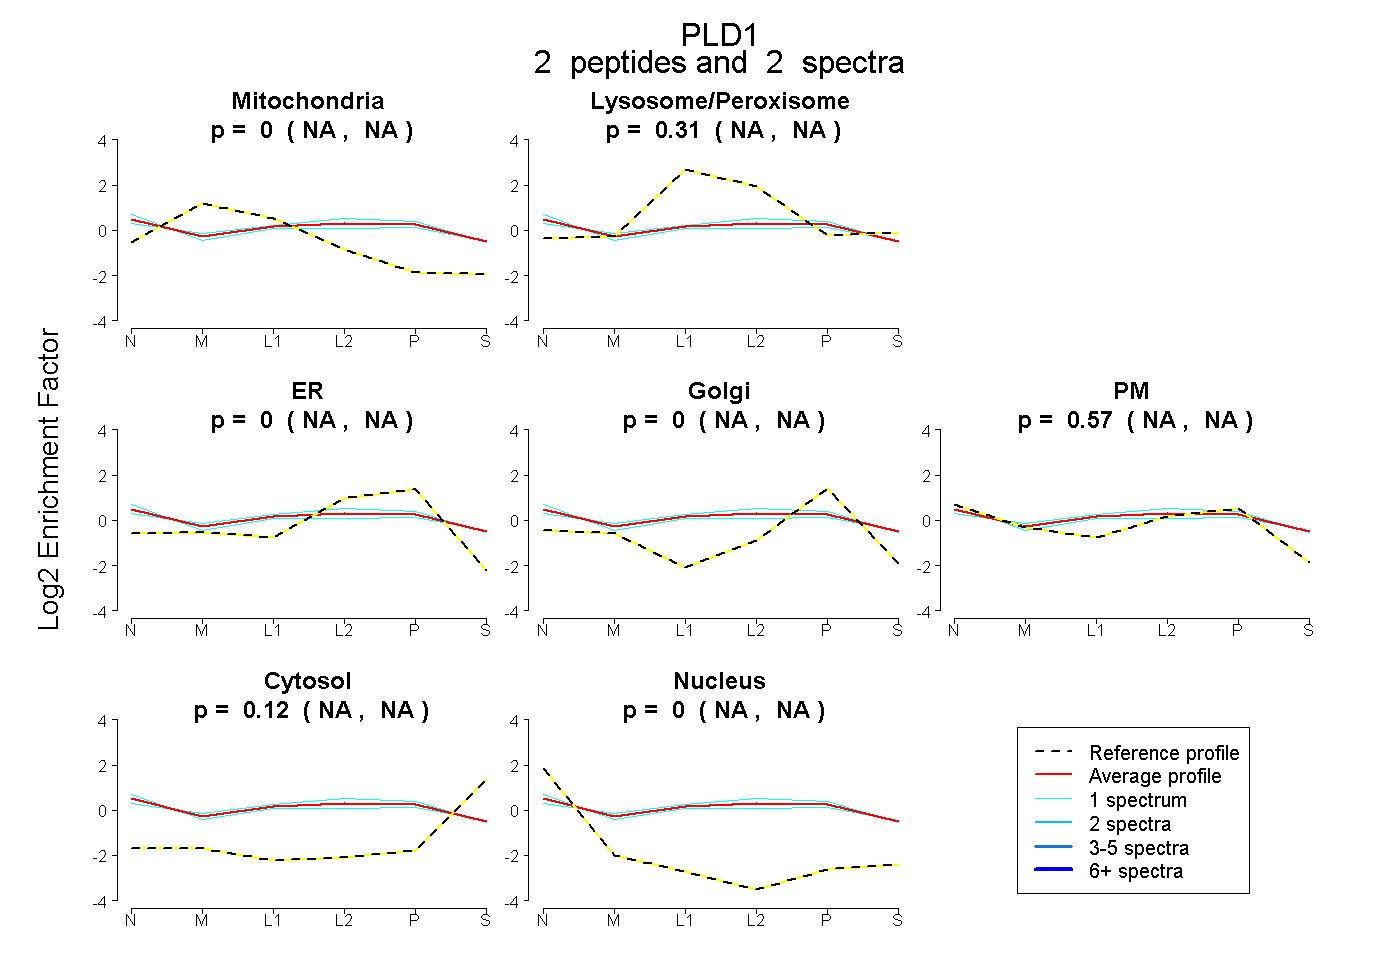
NA | NA
NA | NA
NA | NA
NA | NA
NA | NA
NA | NA
NA | NA
14peptides
spectra
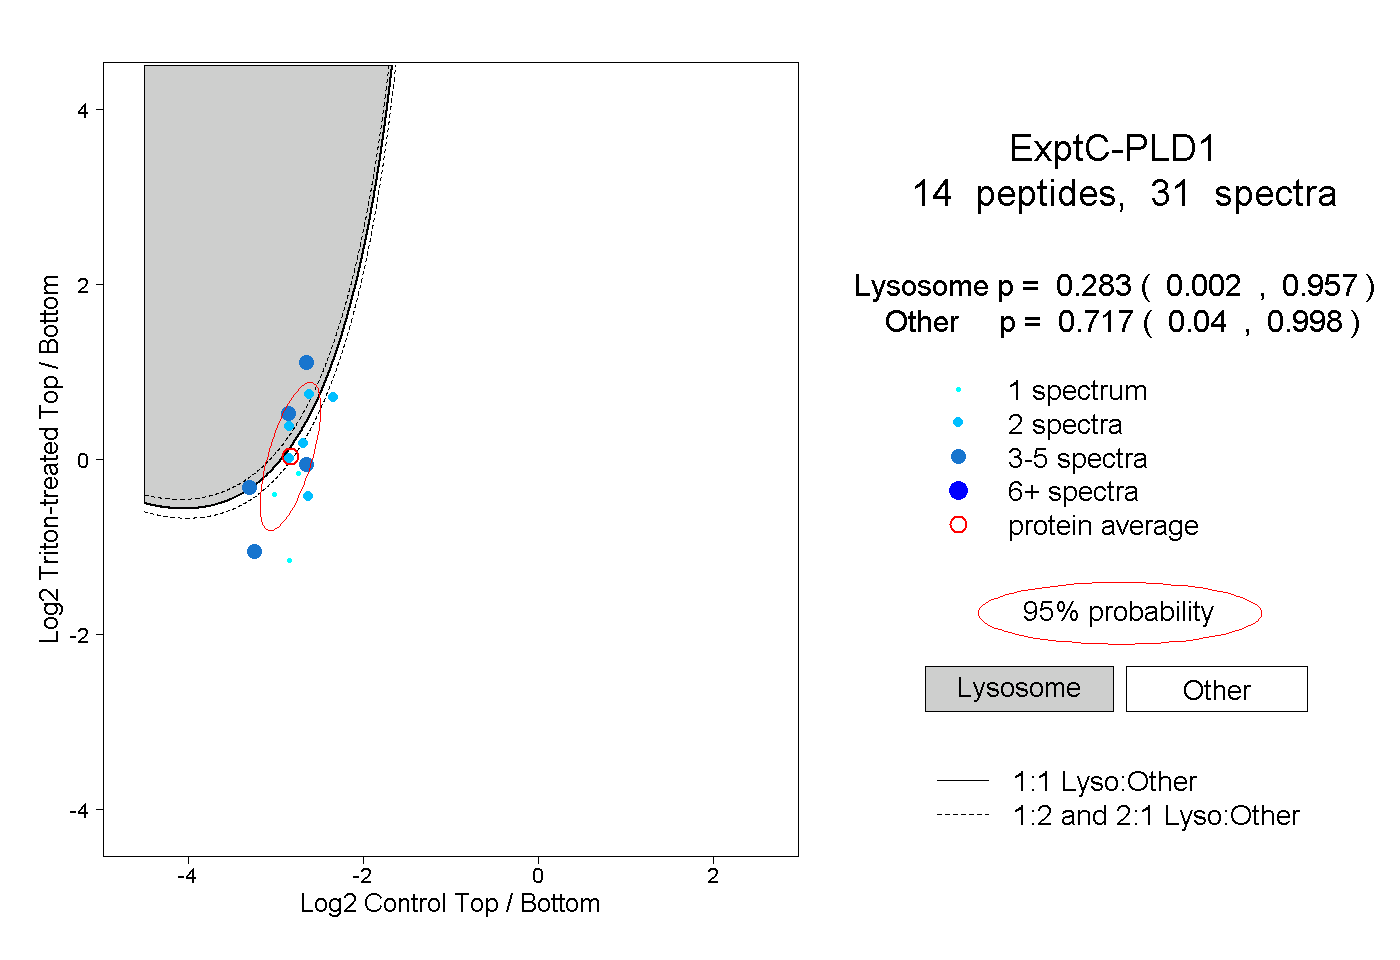
0.002 | 0.957
0.040 | 0.998