 10
10peptides
spectra
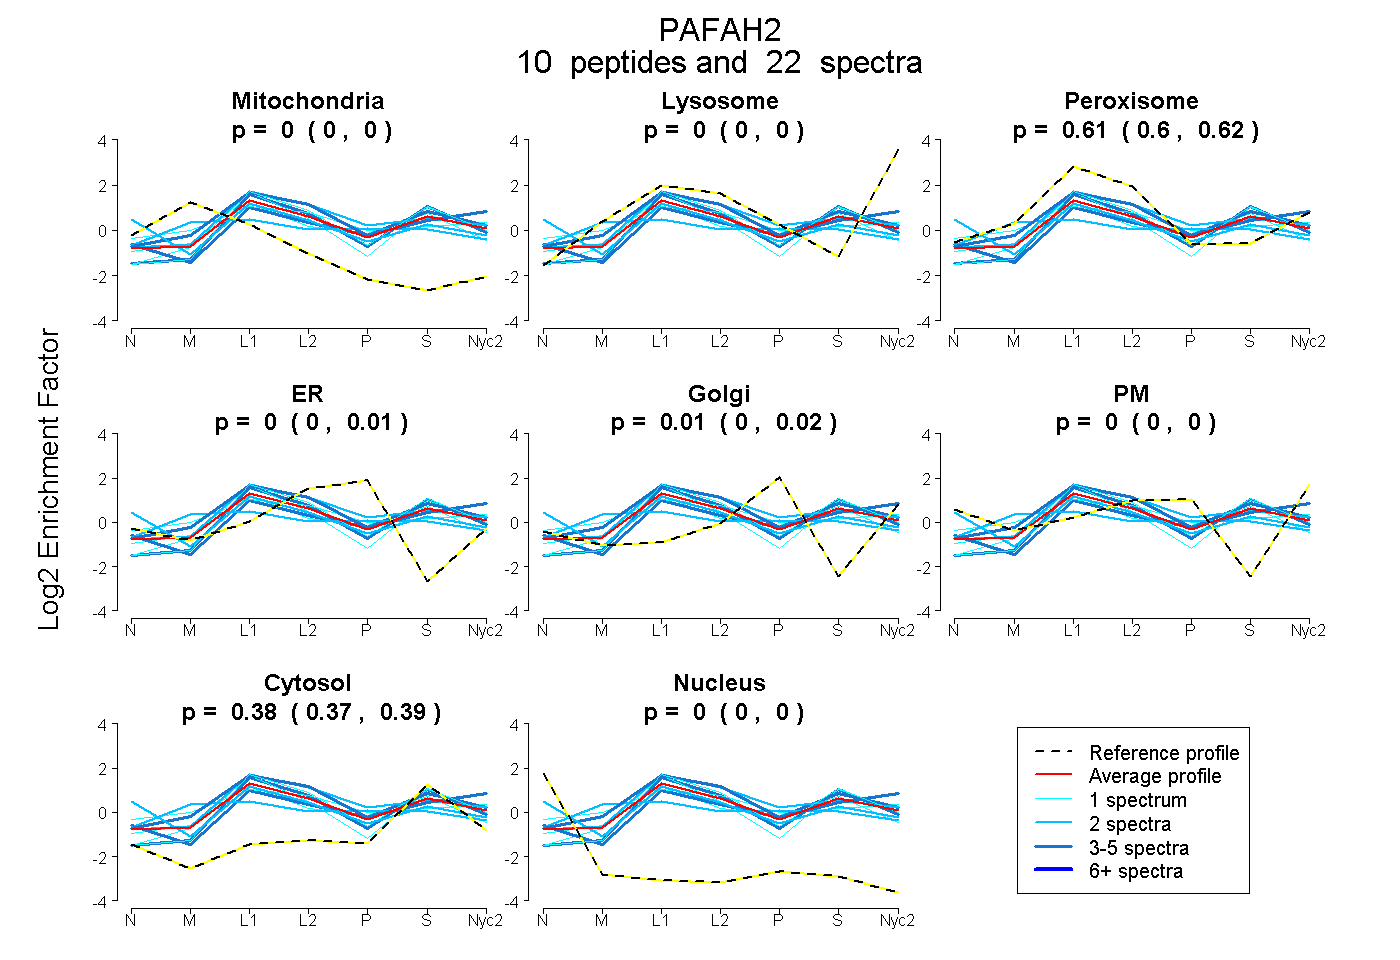
0.000 | 0.000
0.000 | 0.000
0.600 | 0.622
0.000 | 0.013
0.000 | 0.019
0.000 | 0.000
0.368 | 0.386
0.000 | 0.000
4peptides
spectra
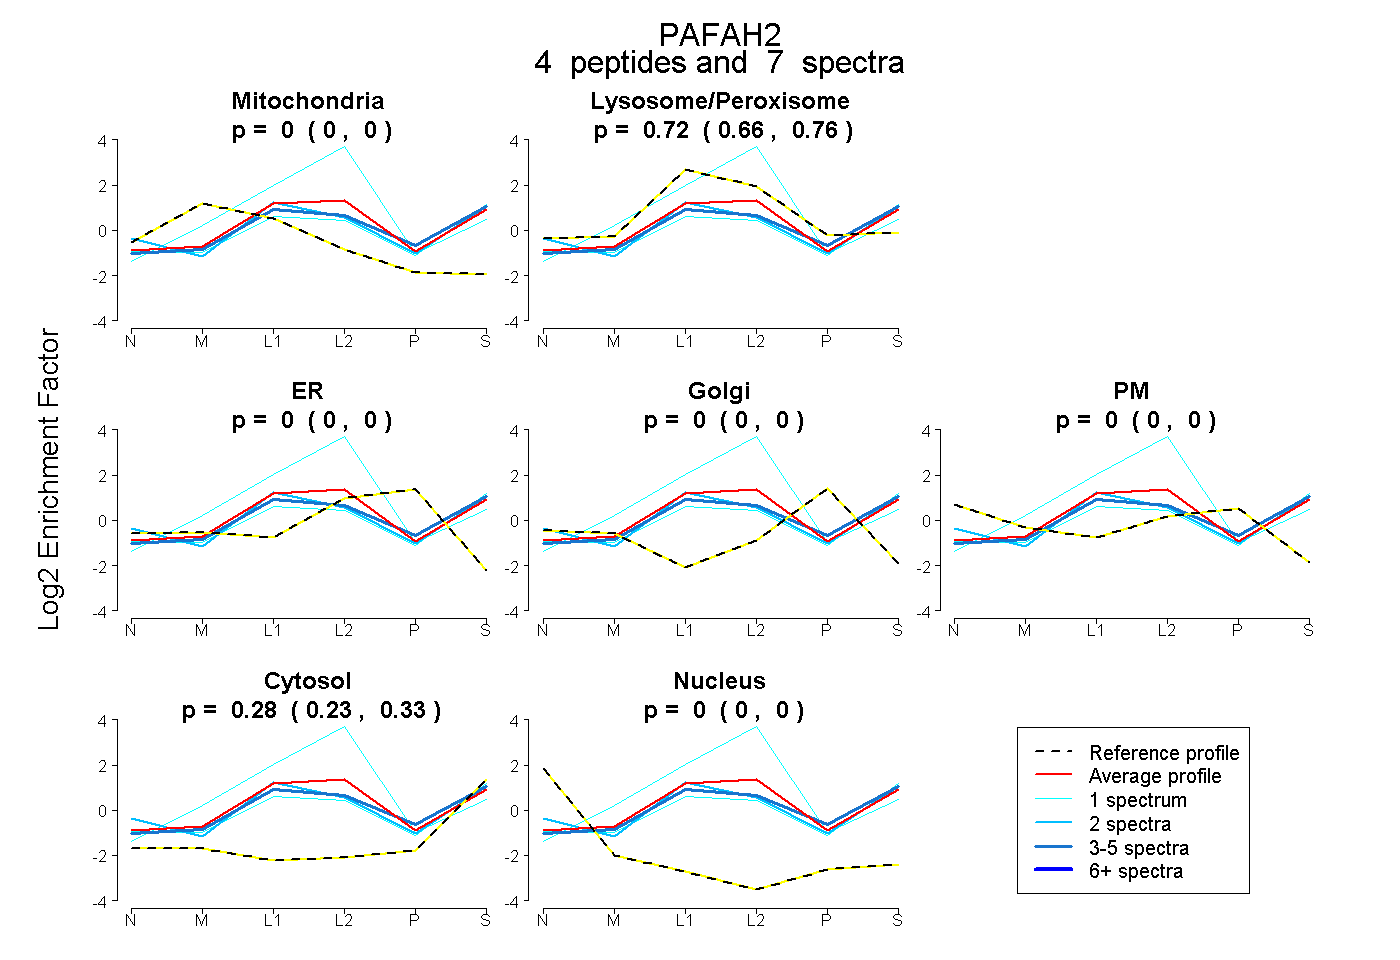
0.000 | 0.000
0.659 | 0.763
0.000 | 0.000
0.000 | 0.000
0.000 | 0.000
0.230 | 0.328
0.000 | 0.000
10peptides
spectra
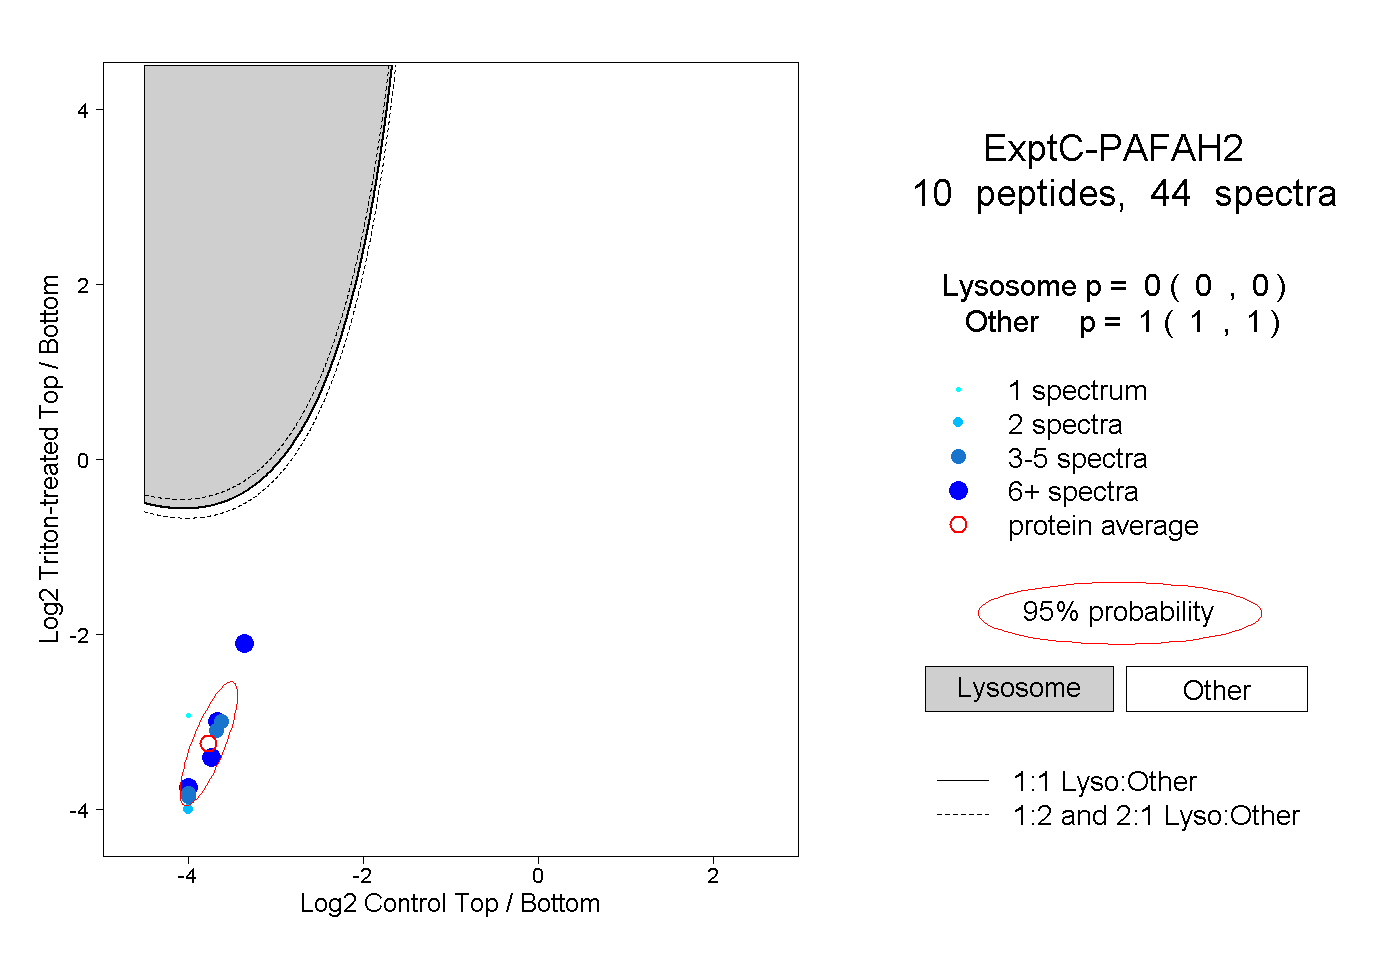
0.000 | 0.000
1.000 | 1.000