 10
10peptides
spectra
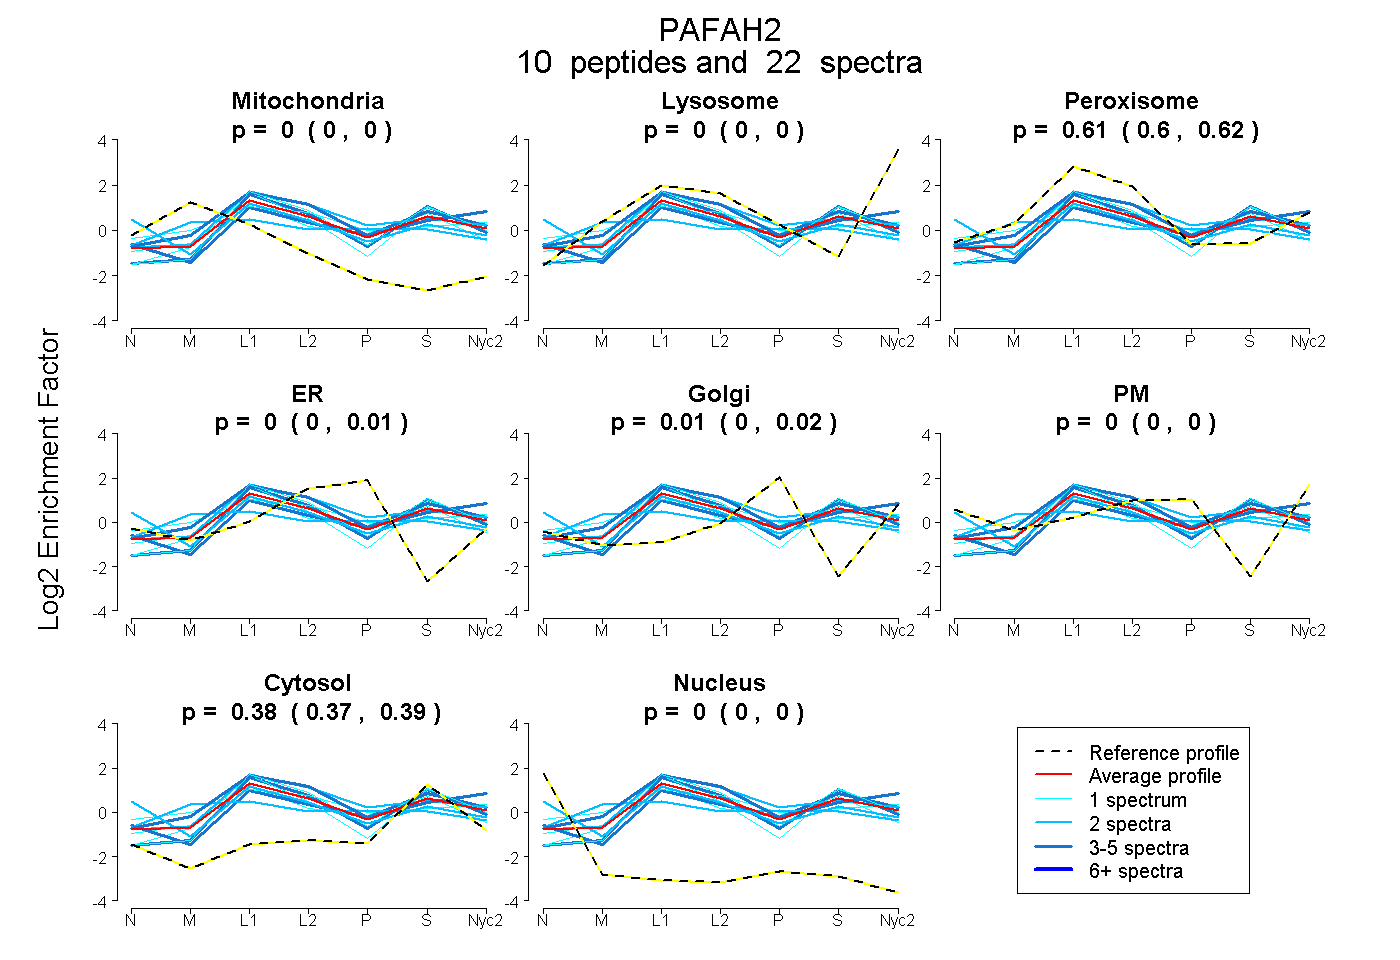
0.000 | 0.000
0.000 | 0.000
0.600 | 0.622
0.000 | 0.013
0.000 | 0.019
0.000 | 0.000
0.368 | 0.386
0.000 | 0.000
| Plot | Mito | Lyso | Perox | ER | Golgi | PM | Cytosol | Nucleus | |||||
| Expt A |
10 peptides |
22 spectra |
|
0.000 0.000 | 0.000 |
0.000 0.000 | 0.000 |
0.614 0.600 | 0.622 |
0.000 0.000 | 0.013 |
0.009 0.000 | 0.019 |
0.000 0.000 | 0.000 |
0.377 0.368 | 0.386 |
0.000 0.000 | 0.000 |
| 1 spectrum, LPVSWNGPFK | 0.000 | 0.000 | 0.594 | 0.000 | 0.000 | 0.000 | 0.406 | 0.000 | ||
| 1 spectrum, DQSAAATYFCK | 0.000 | 0.000 | 0.538 | 0.027 | 0.000 | 0.000 | 0.434 | 0.000 | ||
| 2 spectra, NPQVHQR | 0.000 | 0.000 | 0.583 | 0.000 | 0.000 | 0.040 | 0.276 | 0.101 | ||
| 1 spectrum, GTLDPYEGQEVMVR | 0.000 | 0.000 | 0.599 | 0.000 | 0.138 | 0.022 | 0.241 | 0.000 | ||
| 2 spectra, IVTVLGAVHR | 0.000 | 0.000 | 0.660 | 0.075 | 0.000 | 0.000 | 0.264 | 0.000 | ||
| 3 spectra, AMLAFLQK | 0.000 | 0.000 | 0.571 | 0.000 | 0.000 | 0.000 | 0.429 | 0.000 | ||
| 1 spectrum, ESGYPLIILSHGLGGFR | 0.000 | 0.000 | 0.594 | 0.000 | 0.000 | 0.000 | 0.406 | 0.000 | ||
| 4 spectra, GSIDMSR | 0.000 | 0.003 | 0.497 | 0.000 | 0.038 | 0.000 | 0.462 | 0.000 | ||
| 5 spectra, LFSSGTR | 0.000 | 0.145 | 0.612 | 0.000 | 0.000 | 0.000 | 0.243 | 0.000 | ||
| 2 spectra, ICAQHEQSR | 0.154 | 0.000 | 0.394 | 0.000 | 0.178 | 0.000 | 0.274 | 0.000 |
| Plot | Mito | Lyso or Perox | ER | Golgi | PM | Cytosol | Nucleus | ||||||
| Expt B |
4 peptides |
7 spectra |
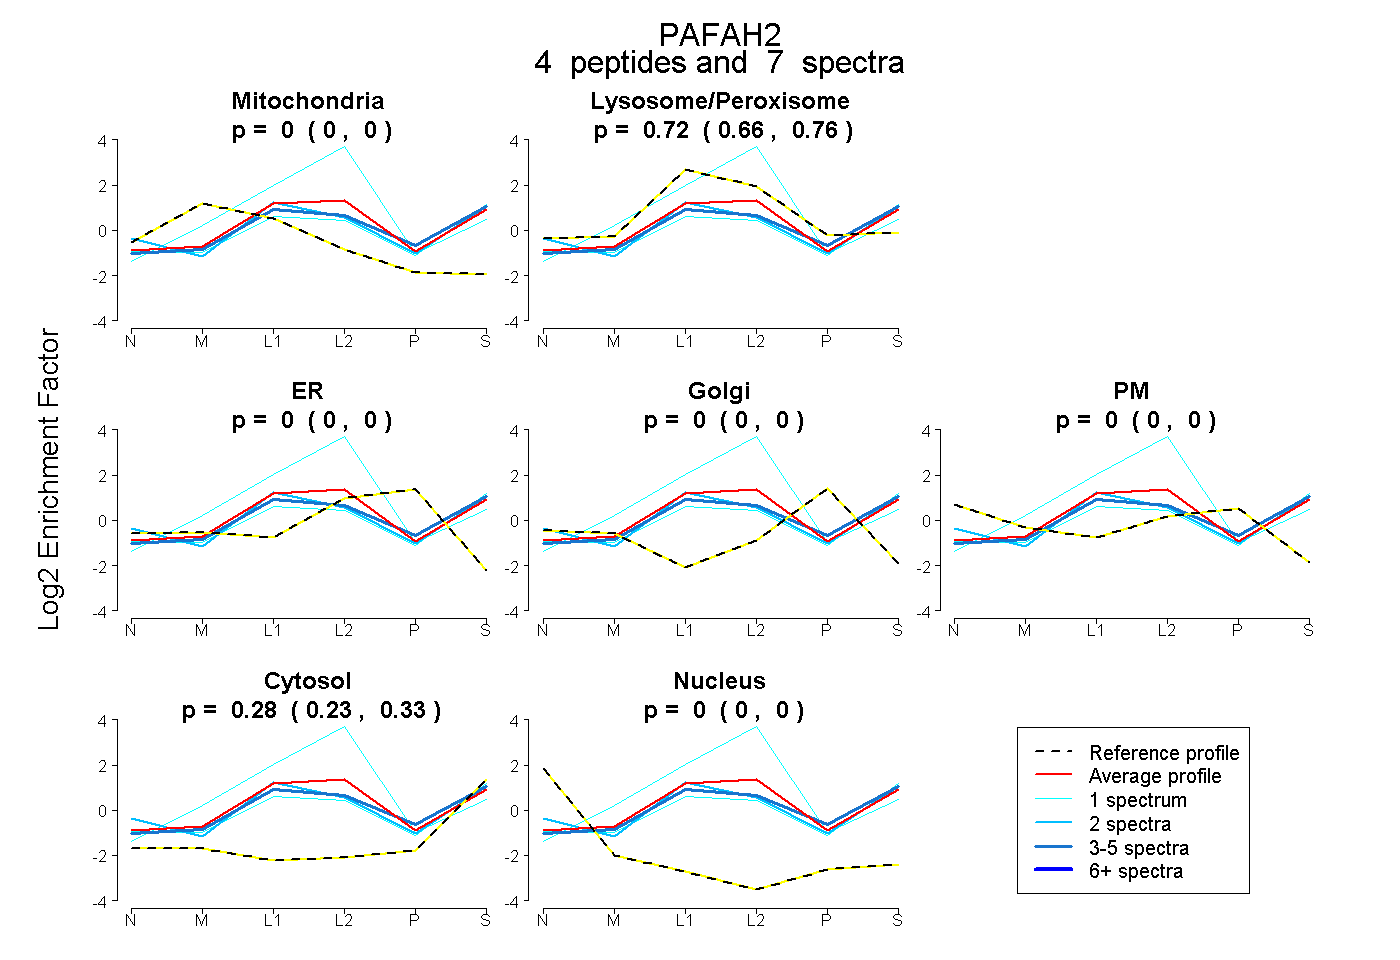 |
0.000 0.000 | 0.000 |
0.716 0.659 | 0.763 |
0.000 0.000 | 0.000 |
0.000 0.000 | 0.000 |
0.000 0.000 | 0.000 |
0.284 0.230 | 0.328 |
0.000 0.000 | 0.000 |
|||
| Plot | Lyso | Other | |||||||||||
| Expt C |
10 peptides |
44 spectra |
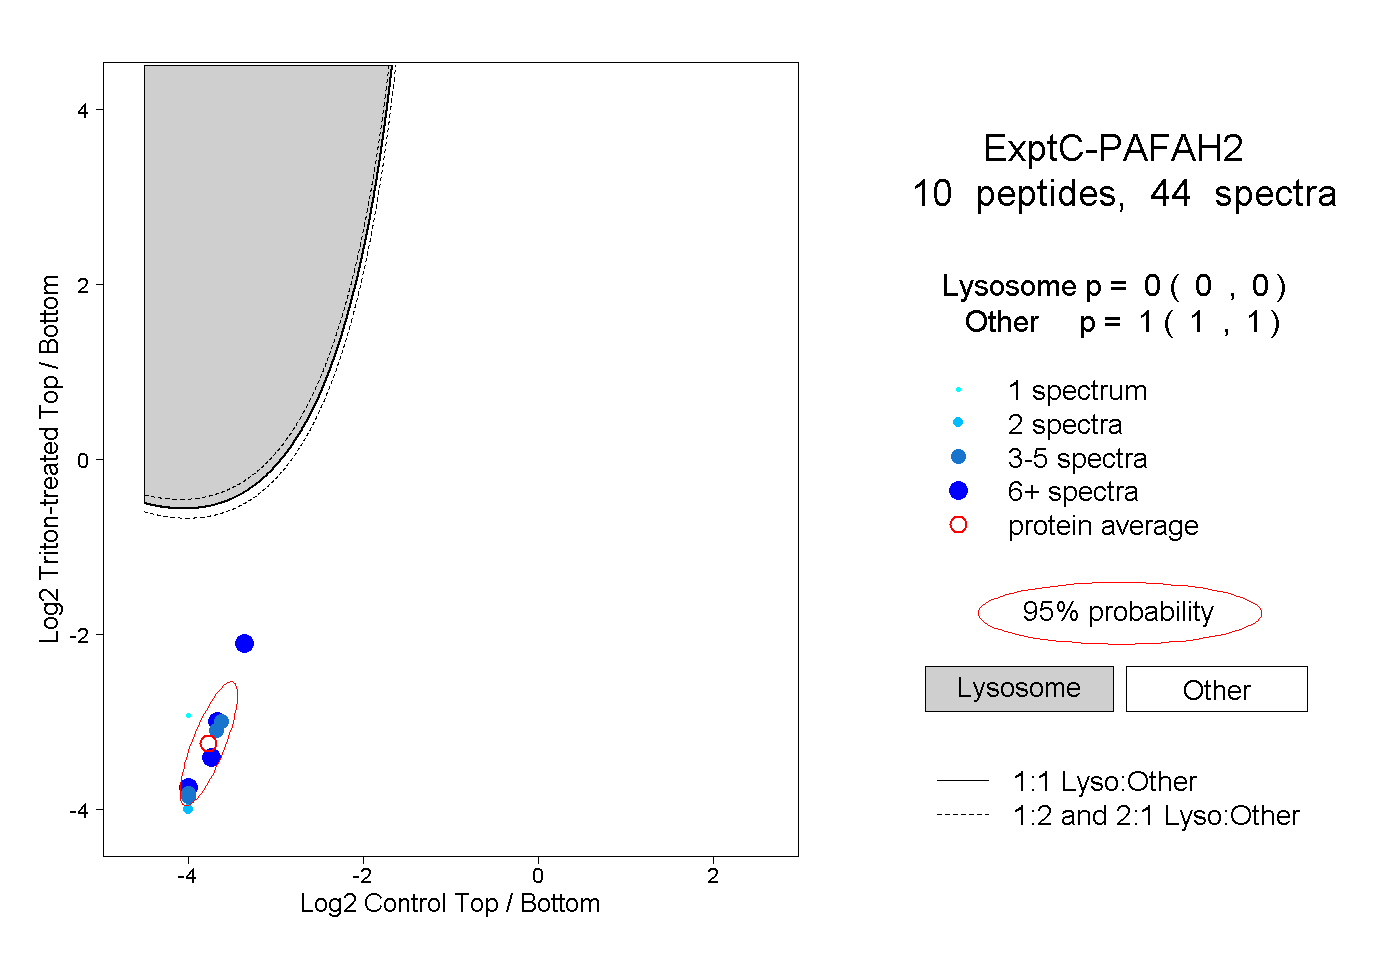 |
0.000 0.000 | 0.000 |
1.000 1.000 | 1.000 |