 5
5peptides
spectra
0.000 | 0.039
0.000 | 0.000
0.000 | 0.006
0.000 | 0.027
0.086 | 0.148
0.702 | 0.814
0.000 | 0.027
0.069 | 0.092
2peptides
spectra
0.000 | 0.000
1.000 | 1.000
| Plot | Mito | Lyso | Perox | ER | Golgi | PM | Cytosol | Nucleus | |||||
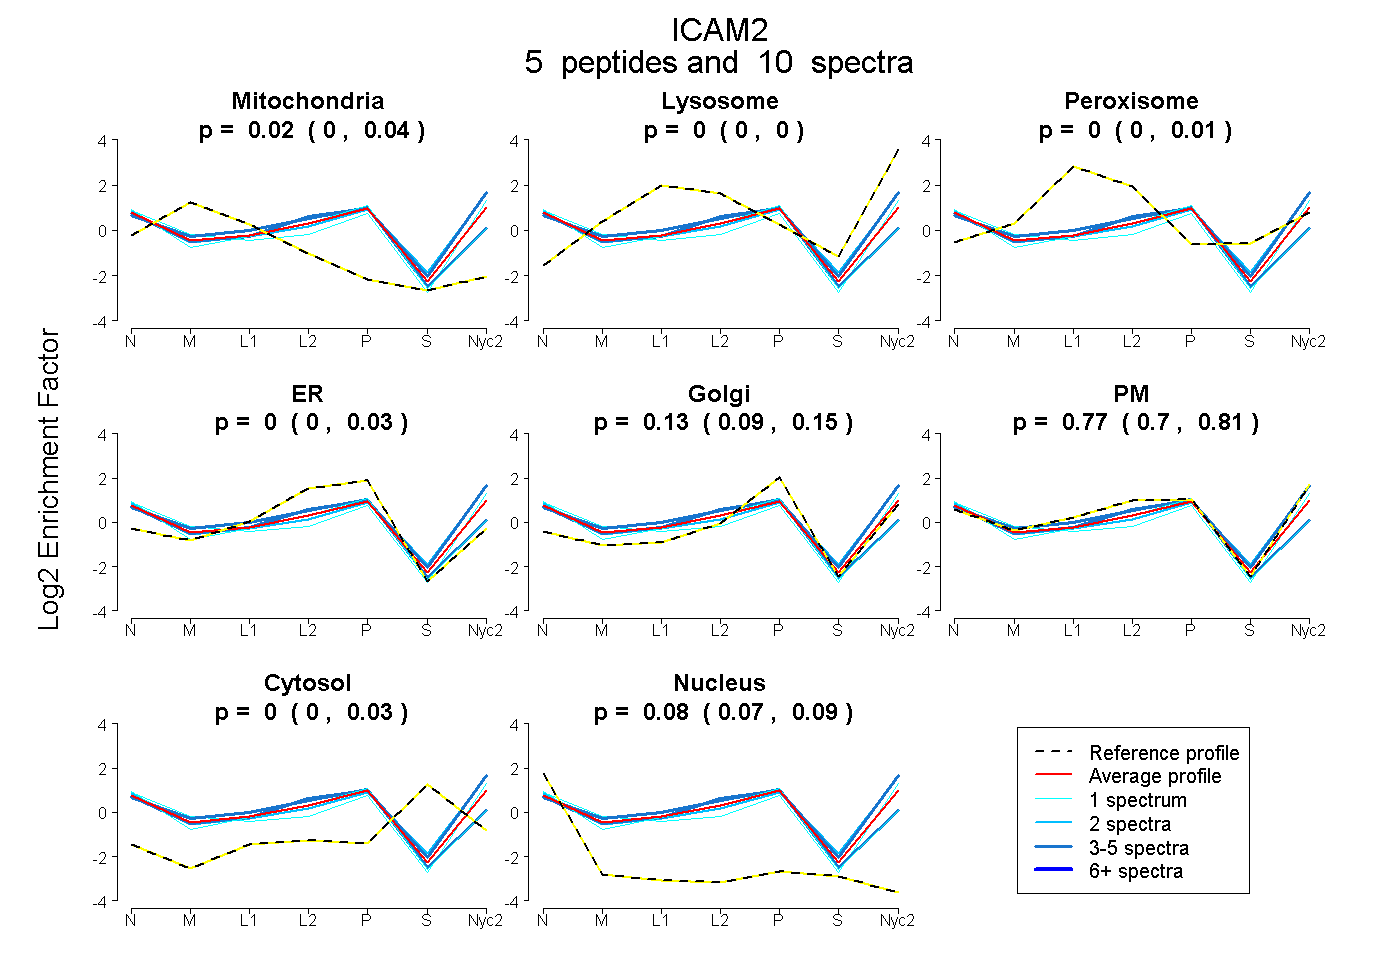
| Expt A |
5 peptides |
10 spectra |
|
0.023 0.000 | 0.039 |
0.000 0.000 | 0.000 |
0.000 0.000 | 0.006 |
0.000 0.000 | 0.027 |
0.127 0.086 | 0.148 |
0.766 0.702 | 0.814 |
0.000 0.000 | 0.027 |
0.084 0.069 | 0.092 |
||
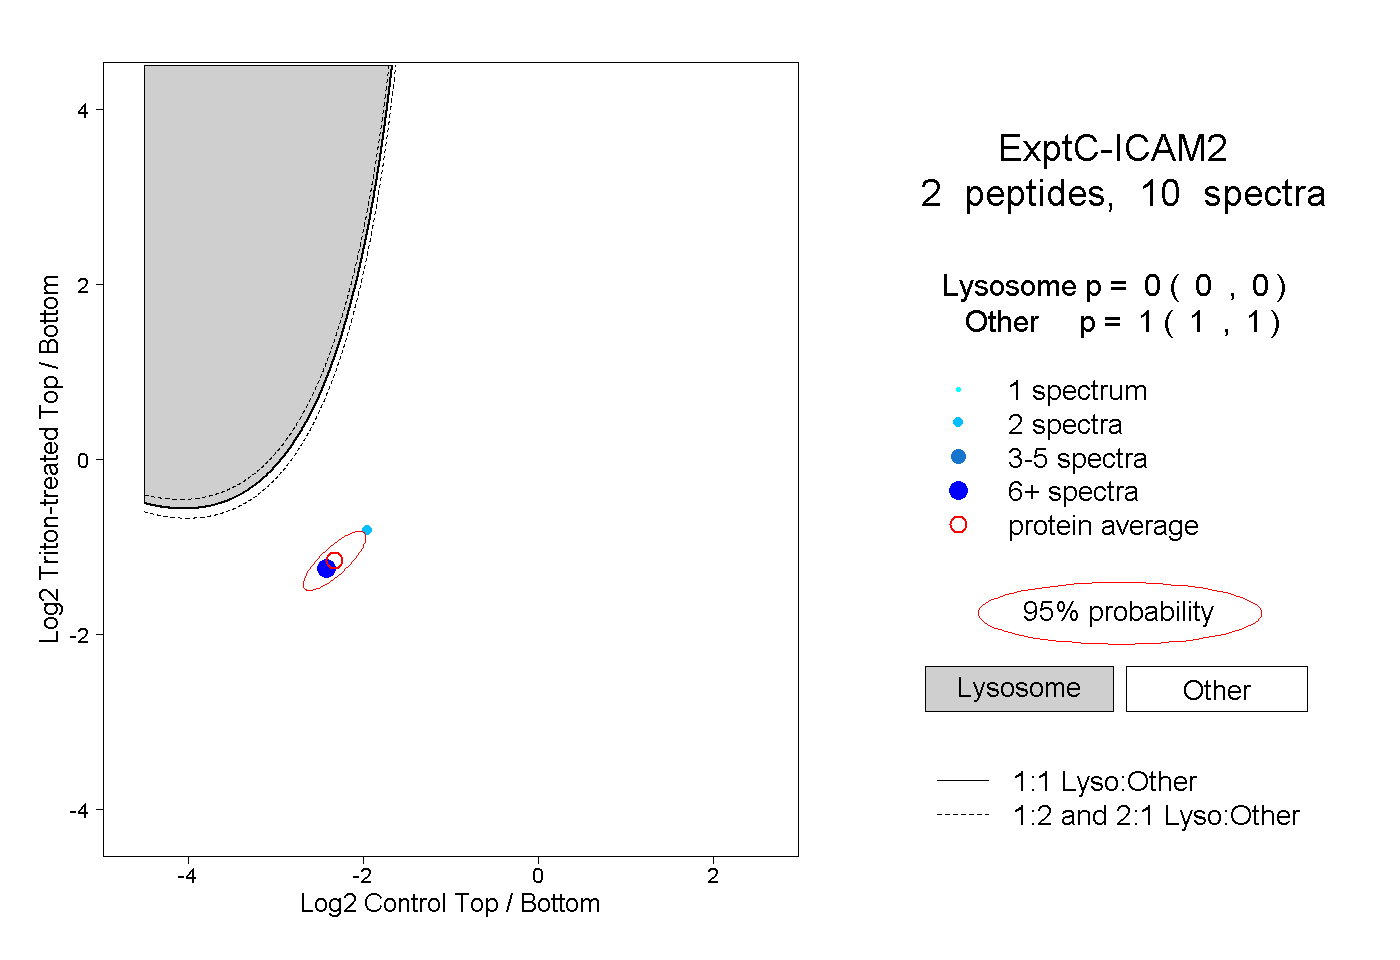
| Plot | Lyso | Other | |||||||||||
| Expt C |
2 peptides |
10 spectra |
|
0.000 0.000 | 0.000 |
1.000 1.000 | 1.000 |