 5
5peptides
spectra
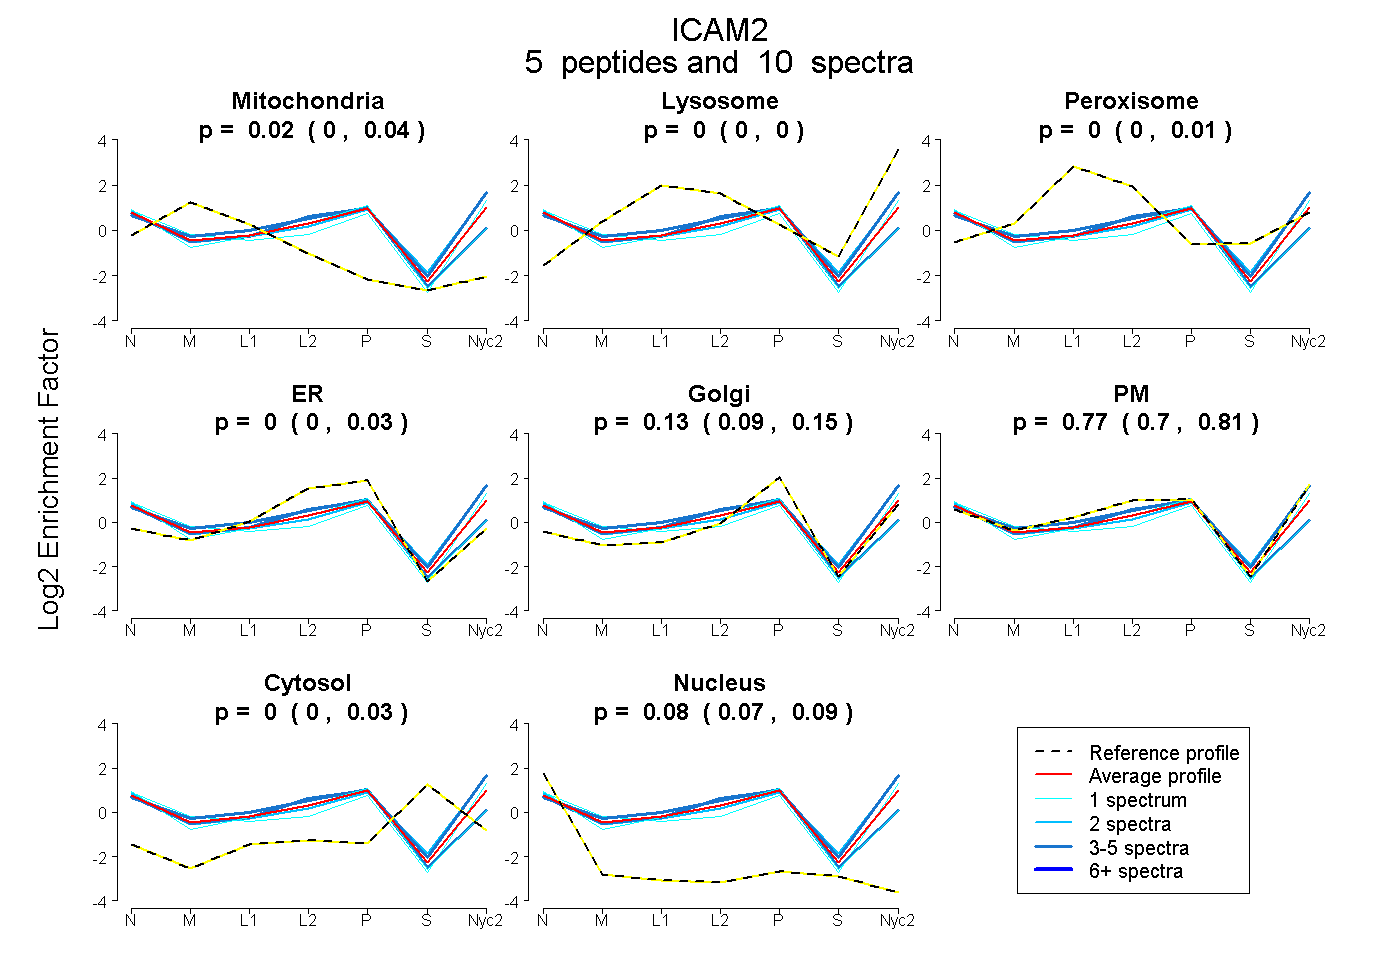
0.000 | 0.039
0.000 | 0.000
0.000 | 0.006
0.000 | 0.027
0.086 | 0.148
0.702 | 0.814
0.000 | 0.027
0.069 | 0.092
| Plot | Mito | Lyso | Perox | ER | Golgi | PM | Cytosol | Nucleus | |||||
| Expt A |
5 peptides |
10 spectra |
|
0.023 0.000 | 0.039 |
0.000 0.000 | 0.000 |
0.000 0.000 | 0.006 |
0.000 0.000 | 0.027 |
0.127 0.086 | 0.148 |
0.766 0.702 | 0.814 |
0.000 0.000 | 0.027 |
0.084 0.069 | 0.092 |
| 2 spectra, ISEYQSLEVYEIR | 0.000 | 0.000 | 0.000 | 0.000 | 0.032 | 0.850 | 0.080 | 0.038 | ||
| 1 spectrum, AFEVYIR | 0.023 | 0.000 | 0.000 | 0.000 | 0.076 | 0.790 | 0.000 | 0.111 | ||
| 1 spectrum, VPSVKPLESLTLSLLCGR | 0.000 | 0.000 | 0.000 | 0.312 | 0.006 | 0.520 | 0.000 | 0.161 | ||
| 3 spectra, VFMGEAFTIECK | 0.111 | 0.000 | 0.000 | 0.337 | 0.000 | 0.485 | 0.000 | 0.068 | ||
| 3 spectra, LMLEEDPHGK | 0.000 | 0.000 | 0.000 | 0.000 | 0.039 | 0.887 | 0.057 | 0.017 |
| Plot | Lyso | Other | |||||||||||
| Expt C |
2 peptides |
10 spectra |
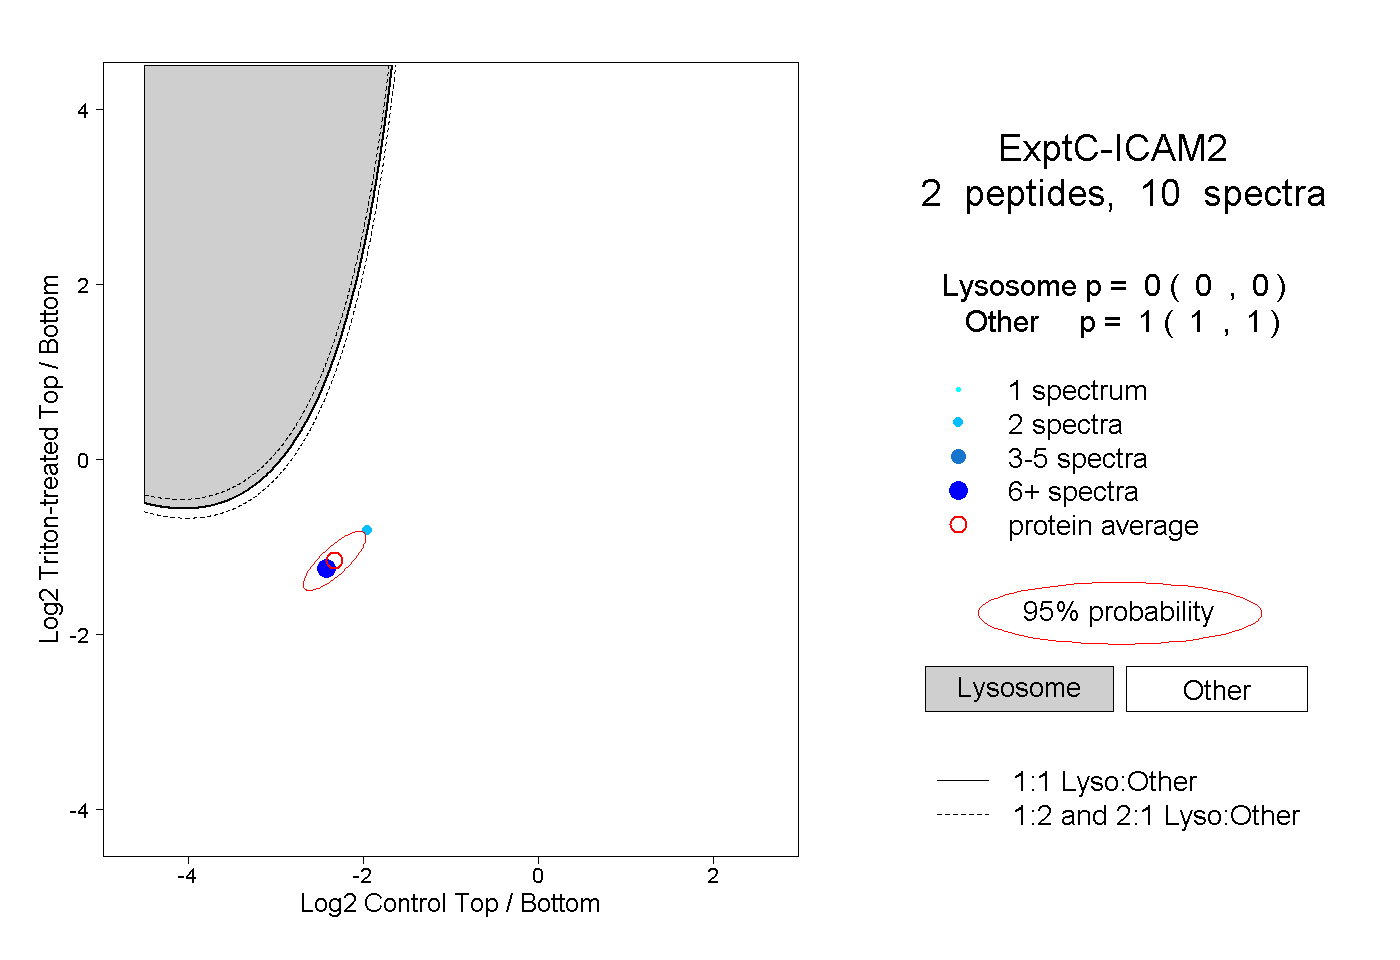 |
0.000 0.000 | 0.000 |
1.000 1.000 | 1.000 |