 3
3peptides
spectra
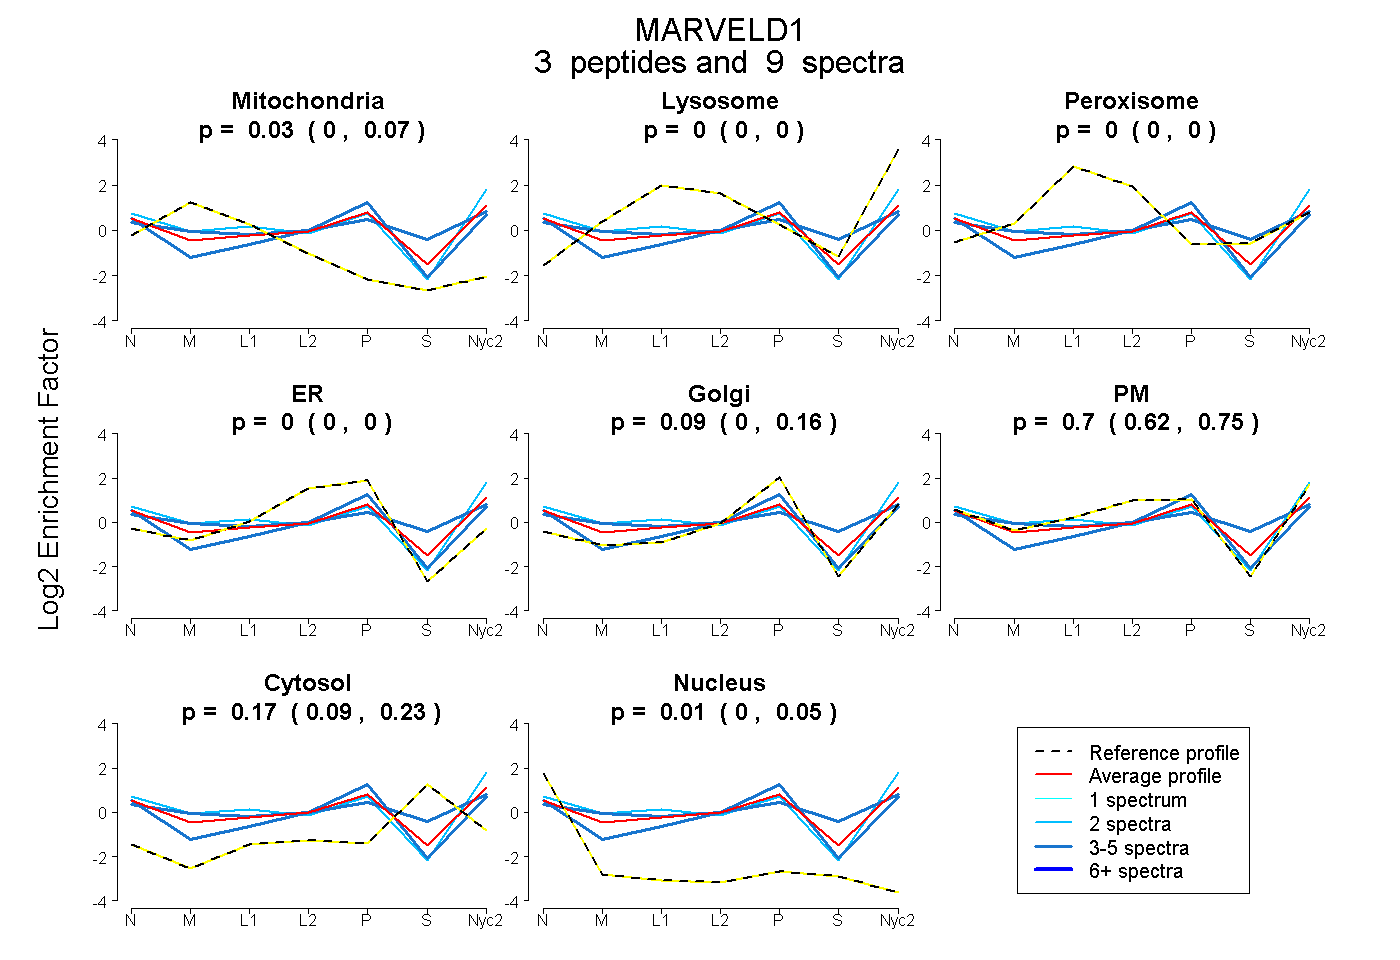
0.000 | 0.072
0.000 | 0.000
0.000 | 0.000
0.000 | 0.000
0.001 | 0.161
0.624 | 0.754
0.086 | 0.228
0.000 | 0.046
2peptides
spectra
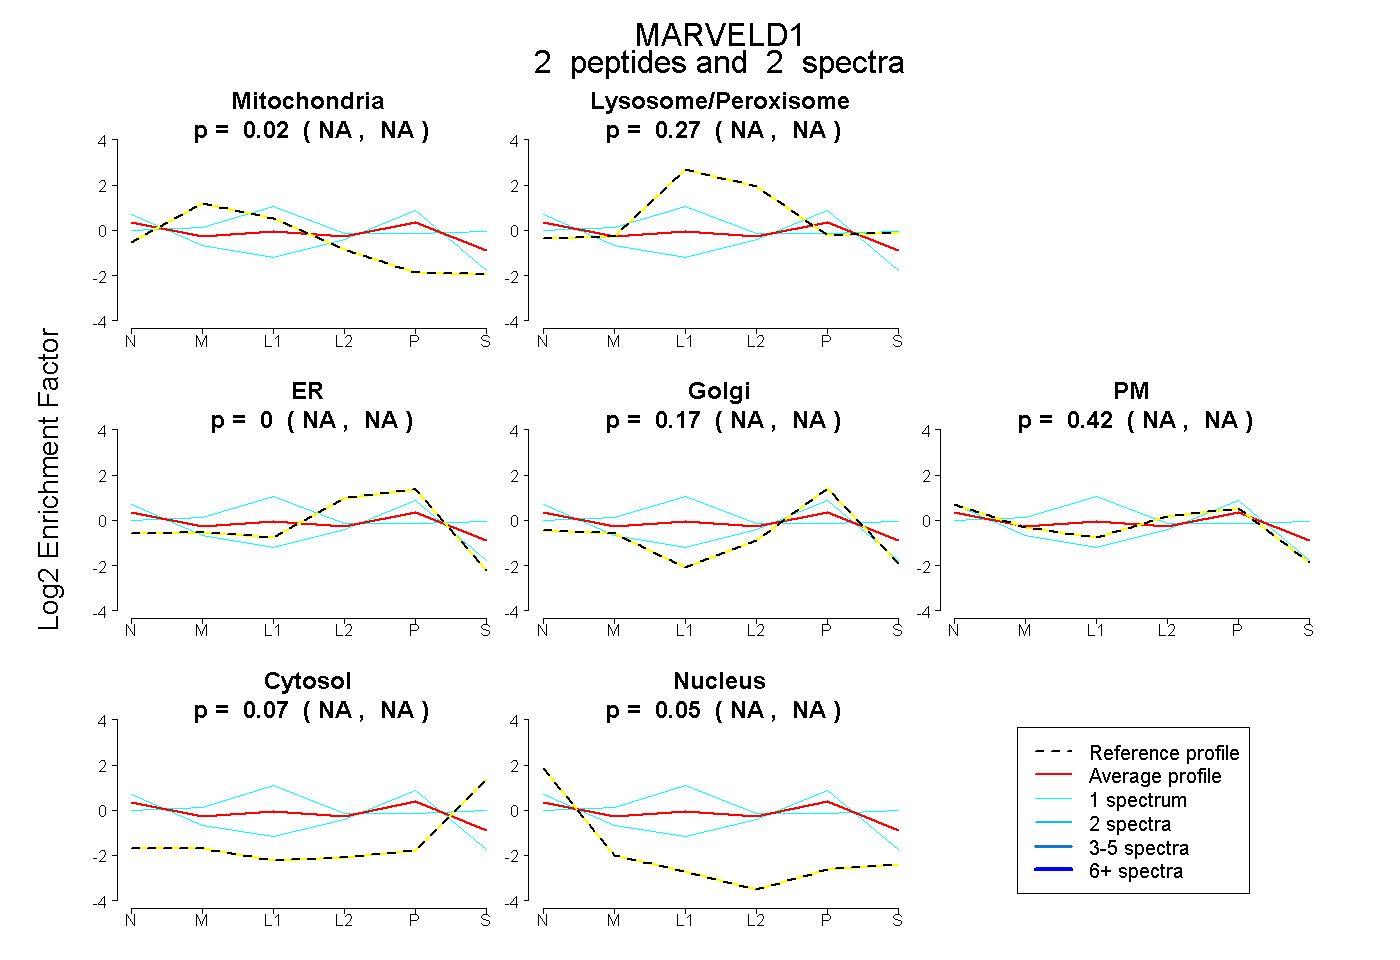
NA | NA
NA | NA
NA | NA
NA | NA
NA | NA
NA | NA
NA | NA
3peptides
spectra
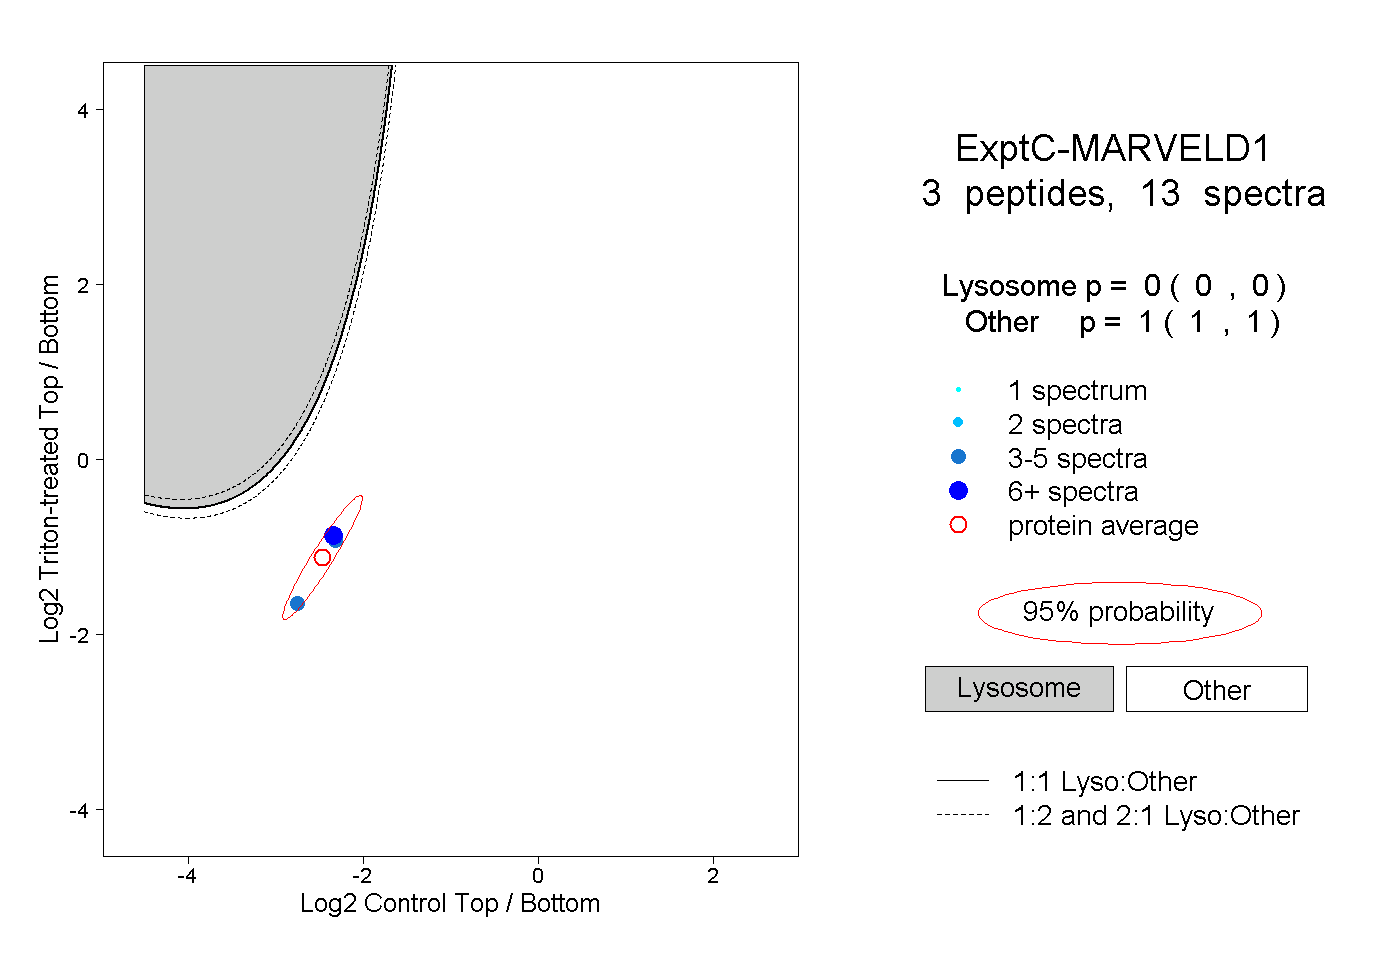
0.000 | 0.000
1.000 | 1.000