 3
3peptides
spectra
0.000 | 0.072
0.000 | 0.000
0.000 | 0.000
0.000 | 0.000
0.001 | 0.161
0.624 | 0.754
0.086 | 0.228
0.000 | 0.046
| Plot | Mito | Lyso | Perox | ER | Golgi | PM | Cytosol | Nucleus | |||||
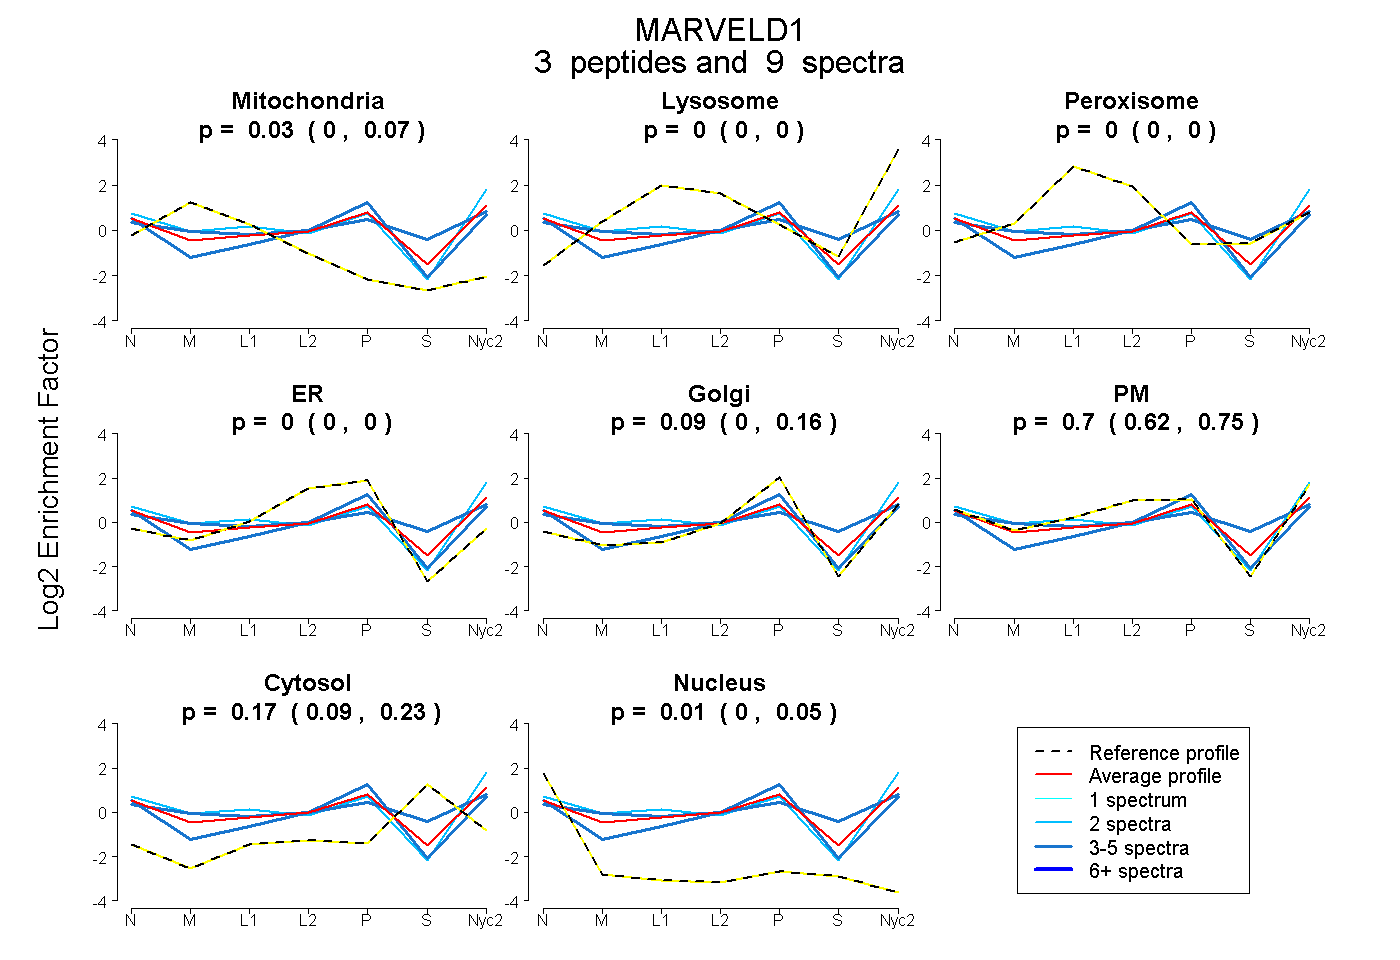
| Expt A |
3 peptides |
9 spectra |
|
0.027 0.000 | 0.072 |
0.000 0.000 | 0.000 |
0.000 0.000 | 0.000 |
0.000 0.000 | 0.000 |
0.092 0.001 | 0.161 |
0.699 0.624 | 0.754 |
0.168 0.086 | 0.228 |
0.014 0.000 | 0.046 |
| 3 spectra, HSYCNLK | 0.149 | 0.000 | 0.010 | 0.000 | 0.416 | 0.425 | 0.000 | 0.000 | ||
| 2 spectra, GPLGVLR | 0.028 | 0.110 | 0.000 | 0.000 | 0.009 | 0.779 | 0.000 | 0.074 | ||
| 4 spectra, QPPPQAR | 0.000 | 0.000 | 0.000 | 0.000 | 0.000 | 0.606 | 0.394 | 0.000 |
| Plot | Mito | Lyso or Perox | ER | Golgi | PM | Cytosol | Nucleus | ||||||
| Expt B |
2 peptides |
2 spectra |
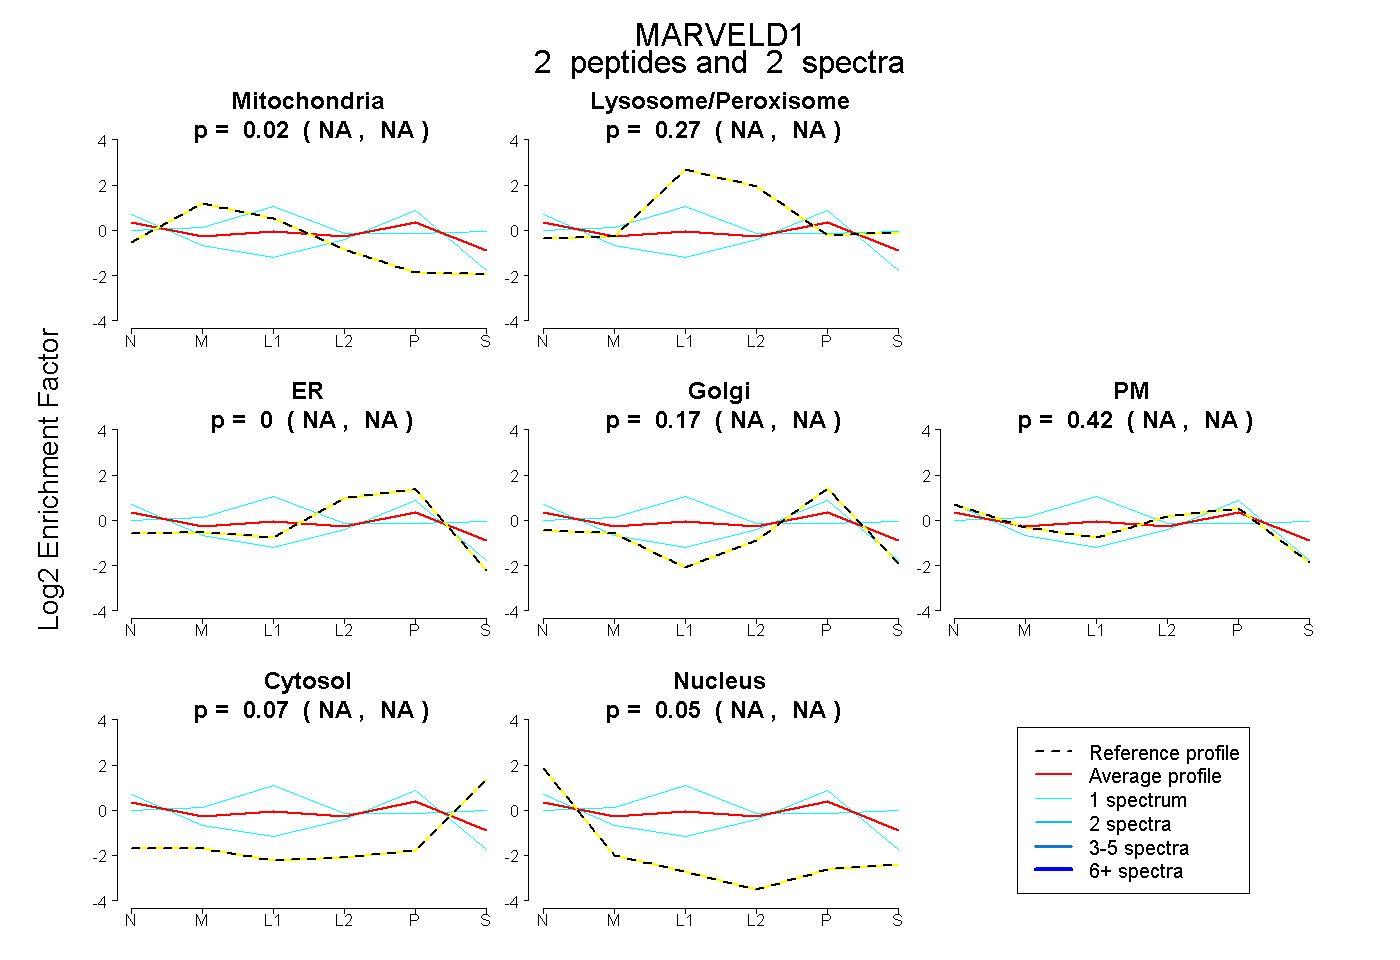 |
0.017 NA | NA |
0.272 NA | NA |
0.000 NA | NA |
0.171 NA | NA |
0.417 NA | NA |
0.073 NA | NA |
0.049 NA | NA |
|||
| Plot | Lyso | Other | |||||||||||
| Expt C |
3 peptides |
13 spectra |
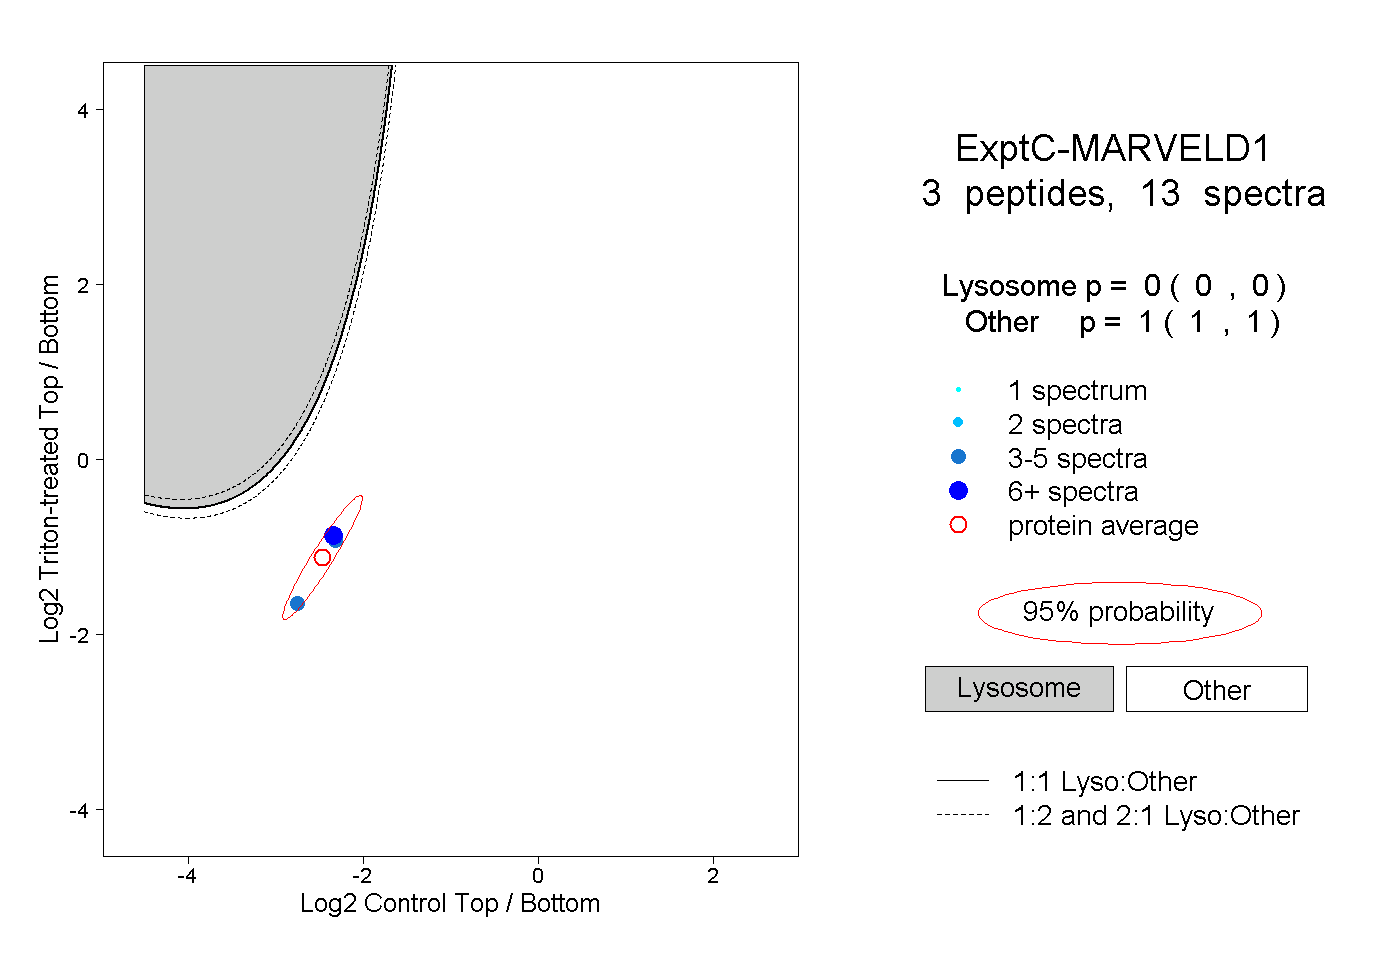 |
0.000 0.000 | 0.000 |
1.000 1.000 | 1.000 |