 111
111peptides
spectra
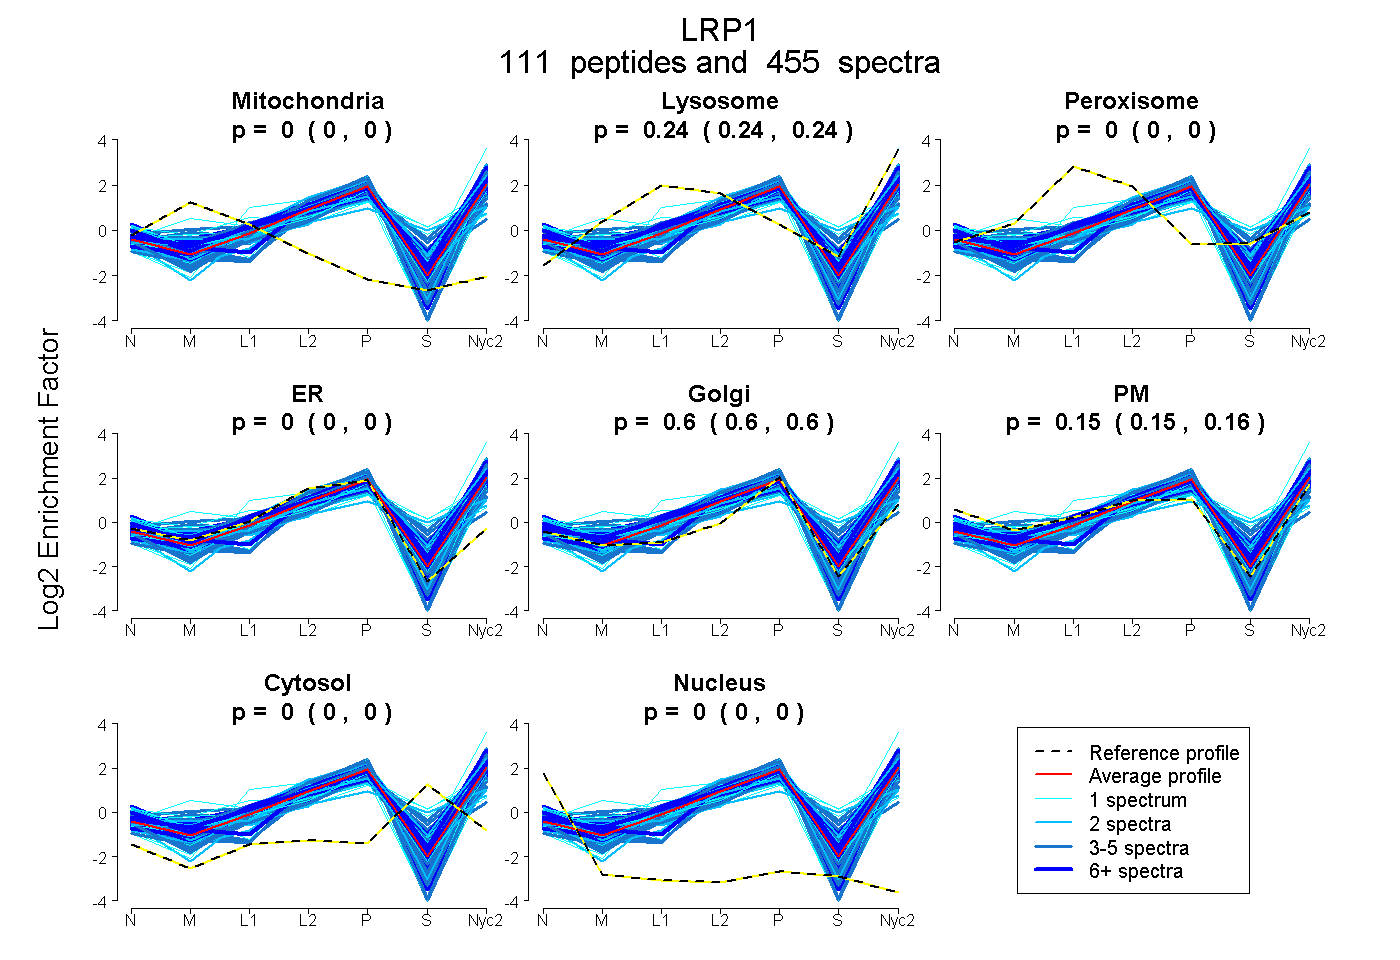
0.000 | 0.000
0.242 | 0.244
0.000 | 0.000
0.000 | 0.000
0.602 | 0.604
0.152 | 0.155
0.000 | 0.000
0.000 | 0.000
47peptides
spectra
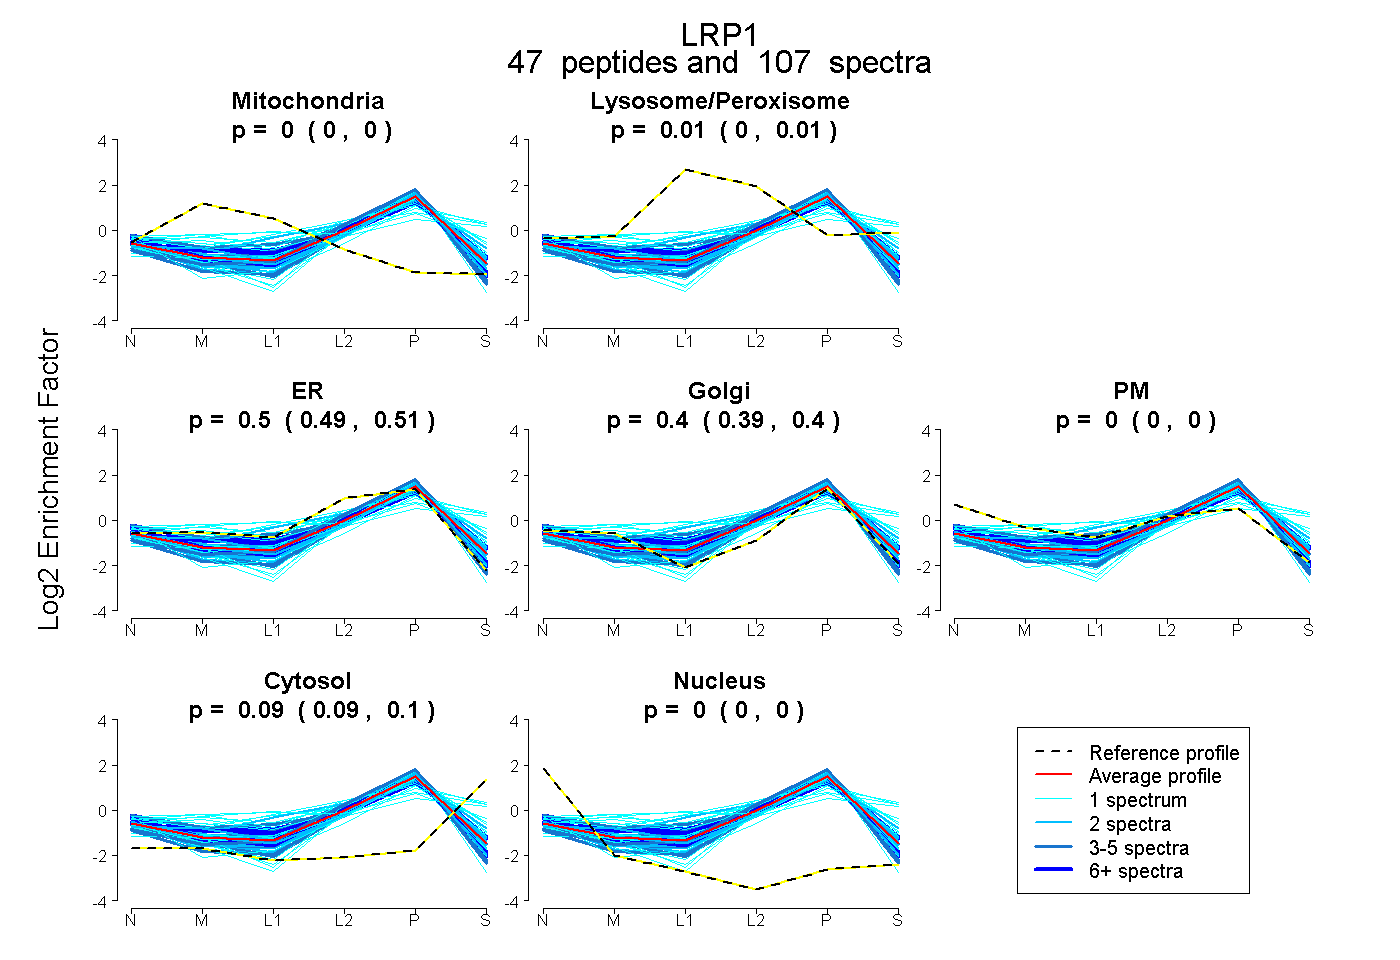
0.000 | 0.000
0.004 | 0.012
0.491 | 0.509
0.391 | 0.405
0.000 | 0.000
0.090 | 0.095
0.000 | 0.000
117peptides
spectra
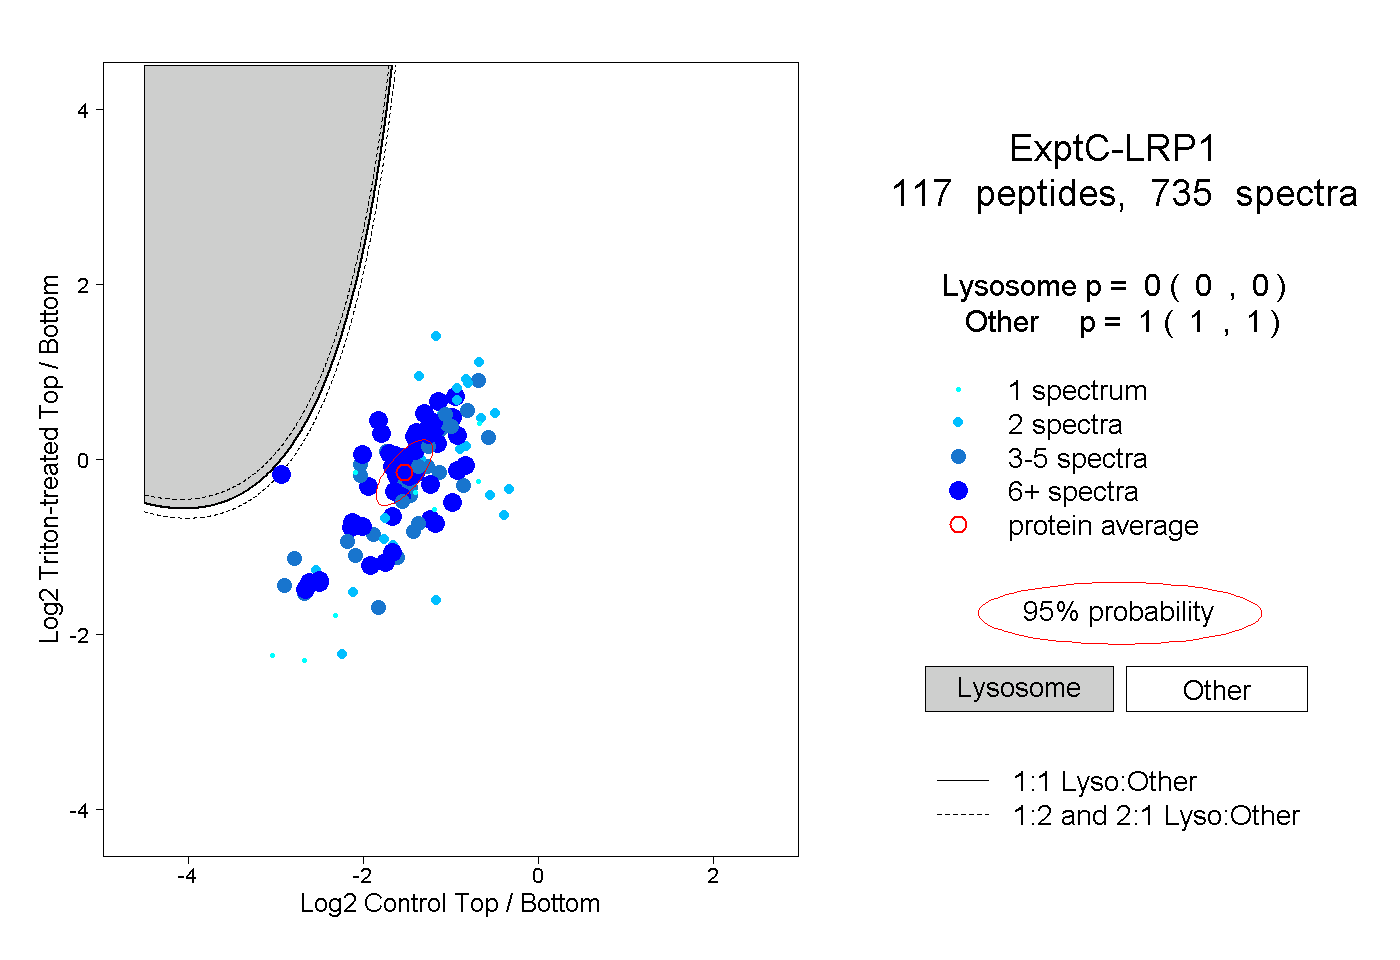
0.000 | 0.000
1.000 | 1.000
38peptides
spectra
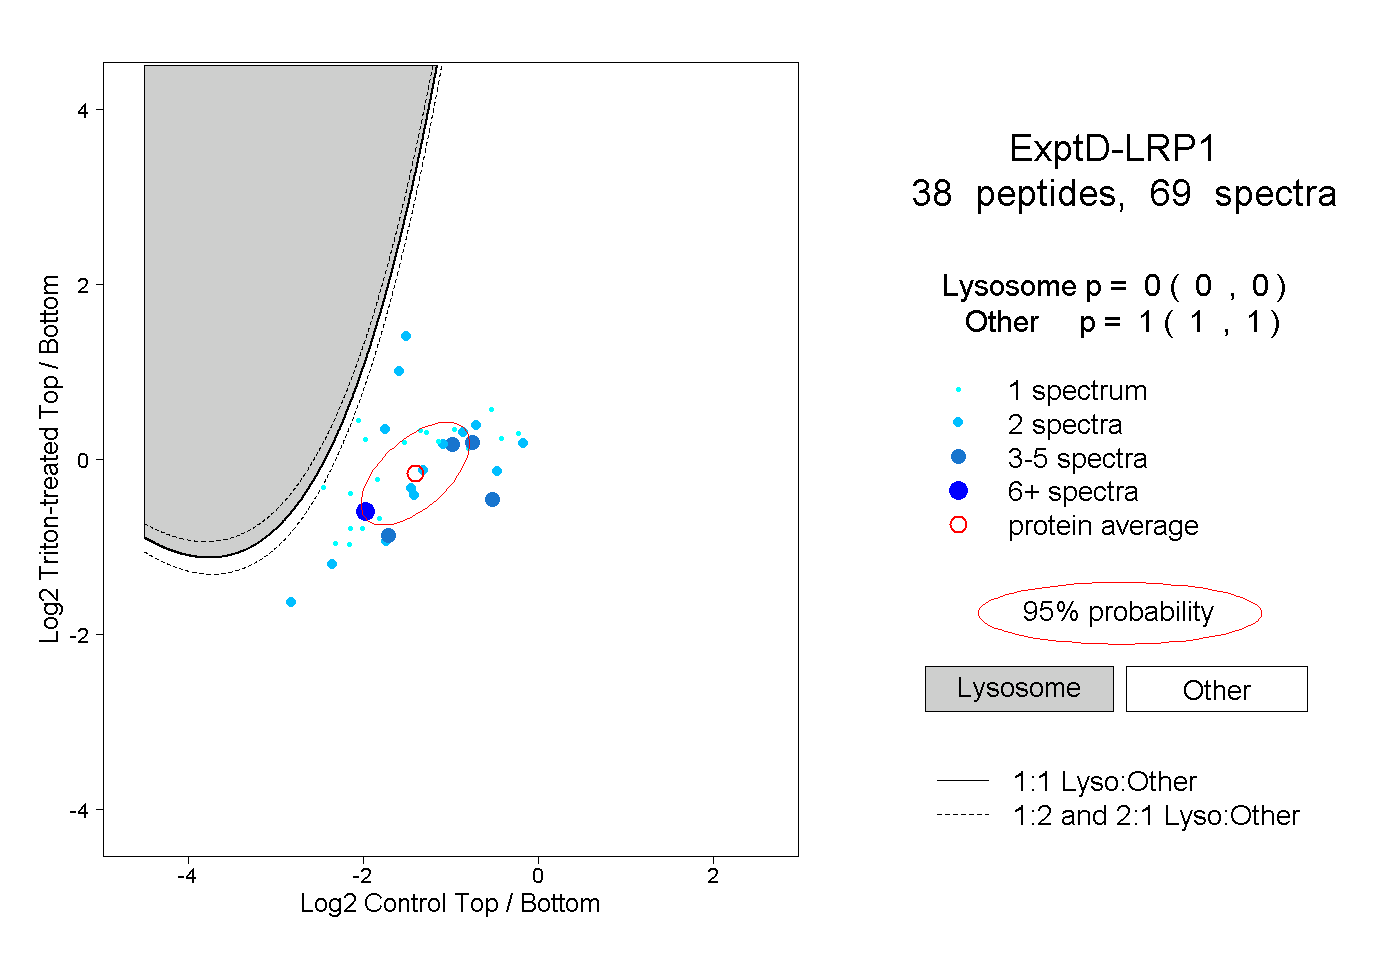
0.000 | 0.000
1.000 | 1.000